avatar tianjara.net | blog icon Andrew Harvey's Blog

Entries tagged "graphics".

Australian States Map/Graph API
19th February 2010

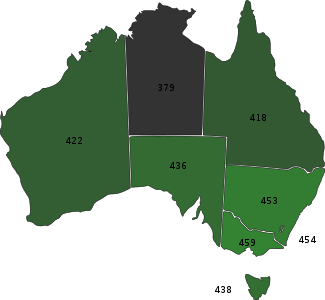
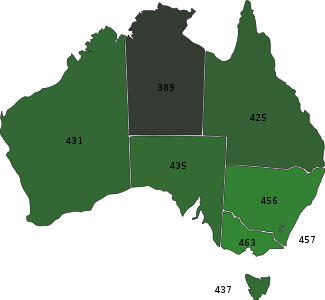
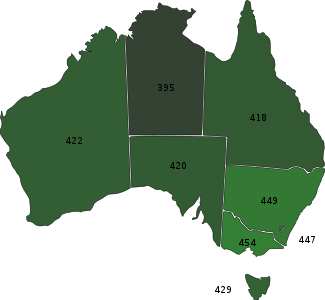
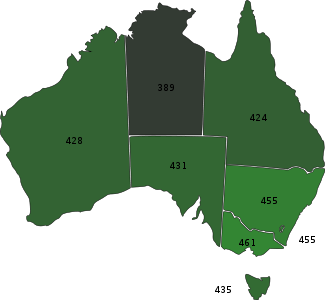
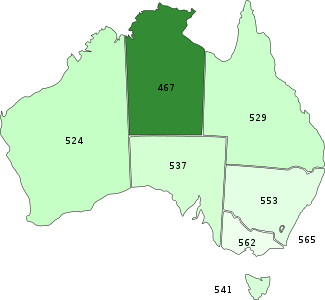
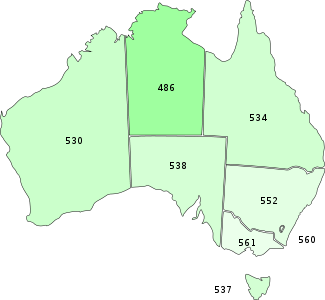
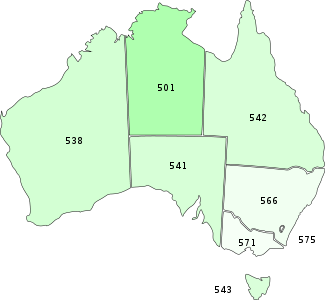
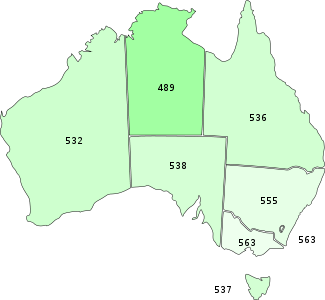
I've managed to do a couple things all in one here. I've made use of some Geoscience Australia Creative Commons licensed material, in a nice little program with a web API, and I've aggregated some data from the myschool scraper and parser. Putting them all together gives some nice images like this.

The program for generating these images basically takes an SVG template file with placeholder markers and then fills these values based on the CGI parameters. The API is fairly simple so one should be able to work out how to use it from the example in the README file. Here are the files I used to make the graphs (and the svg versions as Wordpress.com won't let me upload them to here).

ps. This gets cut off when viewing it from the default web interface of this blog, use print preview or even better look at the RSS feed to see the cut off parts. Also I tried to ensure the accuracy of the data, but I cannot be 100% sure that there are no bugs, in fact there are discrepancies with the averages I get from my scrape of myschool and the averages provided in the report on the NPLAN website. The numbers I get seem to be consistent (ie. the state rankings seem mostly the same), but nonetheless not exactly the same as those reported in the report. Although I would be very surprised if all the numbers I got were exactly the same as in the report. I mainly did this to use map/graph code I wrote, so if you really care about how certain state averages compare in these tests look at the reports on the NPLAN website.

The lighter the colour the higher the number.

Primary

2008 2009
Literacy
Numeracy
All

Secondary

2008 2009
Literacy
Numeracy
All
Tags: computing, education, graphics.
Computer Graphics Notes
2nd December 2009

Not really complete...

Colour notes here, transformations notes here.

Parametric Curves and Surfaces

Parametric Representation

eg. $latex C(t) = (x(t), y(t))$

Continuity

Parametric Continuity

Geometric Continuity

Control Points

Control points allow us to shape/define curves visually. A curve will either interpolate or approximate control points.

Natural Cubic Splines
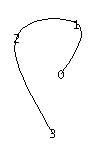
naturalcubic

Bezier Curve

bez2seg

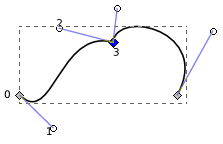
This Bezier curve shown has two segments, where each segment is defined by 4 control points. The curve interpolates two points and approximates the other two. The curve is defined by a Bernstein polynomial. In the diagram changing points 1 and 2 only affects that segment. Changing the corner points (0 and 3) each only affect the two segments that they boarder.

Some properties of Bezier Curves:

Bezier_curveC1

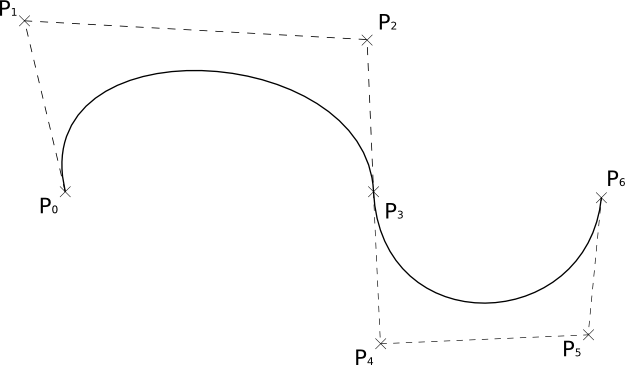
We can join two Bezier curves together to have C1 continuity (where B1(P0, P1, P2, P3) and B2(P0, P1, P2, P3)) if P3 - P2 = P4 - P3. That is P2, P3,  and P4 are colinear and P3 is the midpoint of P2 and P4. To get G1 continuity we just need P2, P3, and P4 to be colinear. If we have G1 continuity but not C1 continuity the curve still won't have any corners but you will notice a "corner" if your using the curve for something else such as some cases in animation. [Also if the curve defined a road without G1 continuity there would be points where you must change the steering wheel from one rotation to another instantly in order to stay on the path.]

De Casteljau Algorithm

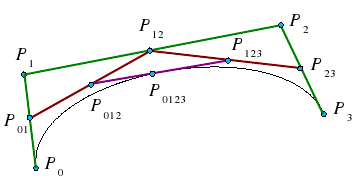
De Casteljau Algorithm is a recursive method to evaluate points on a Bezier curve.
decasteljau

To calculate the point halfway on the curve, that is t = 0.5 using De Casteljau's algorithm we (as shown above) find the midpoints on each of the lines shown in green, then join the midpoints of the lines shown in red, then the midpoint of the resulting line is a point on the curve. To find the points for different values of t, just use that ratio to split the lines instead of using the midpoints. Also note that we have actually split the Bezier curve into two. The first defined by P0, P01, P012, P0123 and the second by P0123, P123, P23, P3.

Curvature

The curvature of a circle is $latex \frac{1}{r}$.

The curvature of a curve at any point is the curvature of the osculating circle at that point. The osculating circle for a point on a curve is the circle that "just touches" the curve at that point. The curvature of a curve corresponds to the position of the steering wheel of a car going around that curve.

Uniform B Splines

Join with C2 continuity.

Any of the B splines don't interpolate any points, just approximate the control points.

Non-Uniform B Splines

Only invariant under affine transformations, not projective transformations.

Rational B Splines

Rational means that they are invariant under projective and affine transformations.

NURBS

Non-Uniform Rational B Splines

Can be used to model any of the conic sections (circle, ellipse, hyperbola)

=====================

3D

When rotating about an axis in OpenGL you can use the right hand rule to determine the + direction (thumb points in axis, finger indicate + rotation direction).

We can think of transformations as changing the coordinate system, where (u, v, n) is the new basis and O is the origin.

$latex \begin{pmatrix}u_x & v_x & n_x & O_x\ u_y & v_y & n_y & O_y\ u_z & v_z & n_z & O_z\ 0 & 0 & 0 & 1 \end{pmatrix}$

This kind of transformation in is known as a local to world transform. This is useful for defining objects which are made up of many smaller objects. It also means to transform the object we just have to change the local to world transform instead of changing the coordinates of each individual vertex. A series of local to world transformations on objects builds up a scene graph, useful for drawing a scene with many distinct models.

Matrix Stacks

OpenGL has MODELVIEW, PROJECTION, VIEWPORT, and TEXTURE matrix modes.

For MODELVIEW operations include glTranslate, glScaled, glRotated... These are post multiplied to the top of the stack, so the last call is done first (ie. a glTranslate then glScaled will scale then translate.).

Any glVertex() called have the value transformed by matrix on the top of the MODELVIEW stack.

Usually the hardware only supports projection and viewport stacks of size 2, whereas the modelview stack should have at least a size of 32.

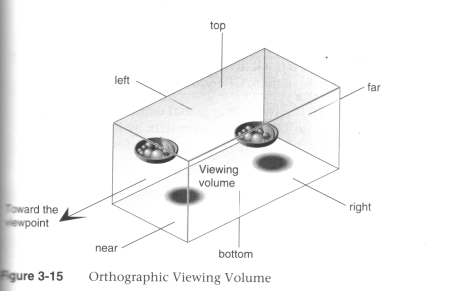
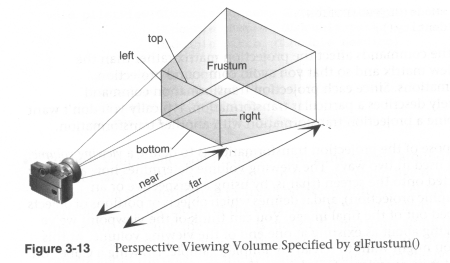
The View Volume

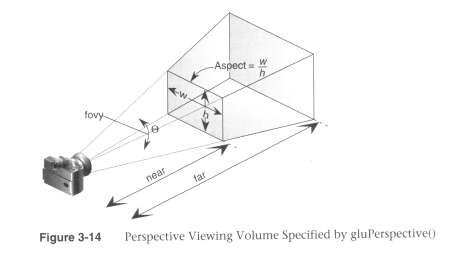
Can set the view volume using,(after setting the the current matrix stack to the PROJECTION stack

In OpenGL the projection method just determines how to squish the 3D space into the canonical view volume.

Then you can set the direction using gluLookAt (after calling one of the above) where you set the eye location, a forward look at vector and an up vector.

When using perspective the view volume will be a frustum, but this is more complicated to clip against than a cube. So we convert the view volume into the canonical view volume which is just a transformation to make the view volume a cube at 0,0,0 of width 2. Yes this introduces distortion but this will be compensated by the final window to viewport transformation.

Remember we can set the viewport with glViewport(left, bottom, width, height) where x and y are a location in the screen (I think this means window, but also this stuff is probably older that modern window management so I'm not worrying about the details here.)

Visible Surface Determination (Hidden Surface Removal)

First clip to the view volume then do back face culling.

Could just sort the polygons and draw the ones further away first (painter's algorithm/depth sorting). But this fails for those three overlapping triangles.

Can fix by splitting the polygons.

BSP (Binary Space Partitioning)

For each polygon there is a region in front and a region behind the polygon. Keep subdividing the space for all the polygons.

Can then use this BSP tree to draw.

void drawBSP(BSPTree m, Point myPos{
   if (m.poly.inFront(myPos)) {
      drawBSP(m.behind, myPos);
      draw(m.poly);
      drawBSP(m.front, myPos);
   }else{
      drawBSP(m.front, myPos);
      draw(m.poly);
      drawBSP(m.behind, myPos);
   }
}

If one polygon's plane cuts another polygon, need to split the polygon.

You get different tree structures depending on the order you select the polygons. This does not matter, but some orders will give a more efficient result.

Building the BSP tree is slow, but it does not need to be recalculated when the viewer moves around. We would need to recalculate the tree if the polygons move or new ones are added.

BSP trees are not so common anymore, instead the Z buffer is used.

Z Buffer

Before we fill in a pixel into the framebuffer, we check the z buffer and only fill that pixel is the z value (can be a pseudo-depth) is less (large values for further away) than the one in the z buffer. If we fill then we must also update the z buffer value for that pixel.

Try to use the full range of values for each pixel element in the z buffer.

To use in OpenGL just do gl.glEnable(GL.GL_DEPTH_TEST) and to clear the z-buffer use gl.glClear(GL.GL_DEPTH_BUFFER_BIT).

Fractals

L-Systems

Line systems. eg. koch curve

Self-similarity

IFS - Iterated Function System

================================================

Shading Models

There are two main types of rendering that we cover,

Polygon rendering is used to apply illumination models to polygons, whereas ray tracing applies to arbitrary geometrical objects. Ray tracing is more accurate, whereas polygon rendering does a lot of fudging to get things to look real, but polygon rendering is much faster than ray tracing.

We start with a simple model and build up,

Lets assume each object has a defined colour. Hence our illumination model is $latex I = k_i$, very simple, looks unrealistic.

Now we add ambient light into the scene. Ambient Light is indirect light (ie. did not come straight from the light source) but rather it has reflected off other objects (from diffuse reflection). $latex I = I_a k_a$. We will just assume that all parts of our object have the same amount of ambient light illuminating them for this model.

Next we use the diffuse illumination model to add shading based on light sources. This works well for non-reflective surfaces (matte, not shiny) as we assume that light reflected off the object is equally reflected in every direction.

Lambert's Law

"intensity of light reflected from a surface is proportional to the cosine of the angle between L (vector to light source) and N(normal at the point)."

Gouraud Shading

Use normals at each vertex to calculate the colour of that vertex (if we don't have them, we can calculate them from the polygon normals for each face). Do for each vertex in the polygon and interpolate the colour to fill the polygon. The vertex normals address the common issue that our polygon surface is just an approximation of a curved surface.

To use gouraud shading in OpenGL use glShadeModel(GL_SMOOTH). But we also need to define the vertex normals with glNormal3f() (which will be set to any glVertex that you specify after calling glNormal).

Highlights don't look realistic as you are only sampling at every vertex.

Interpolated shading is the same, but we use the polygon normal as the normal for each vertex, rather than the vertex normal.

Phong Shading

Like gouraud, but you interpolate the normals and then apply the illumination equation for each pixel.

This gives much nicer highlights without needing to increase the number of polygons, as you are sampling at every pixel.

Phong Illumination Model

Diffuse reflection and specular reflection.

Components of the Phong Model (Brad Smith, http://commons.wikimedia.org/wiki/File:Phong_components_version_4.png)
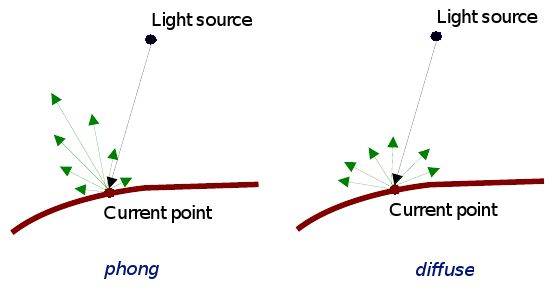

Source: Lambert (Source: COMP3421, Lecture Slides.)

$latex I_s = I_l k_s \cos^n \left ( \alpha \right )$

n is the Phong exponent and determines how shiny the material (the larger n the smaller the highlight circle).

Flat shading. Can do smooth shading with some interpolation.

If you don't have vertex normals, you can interpolate it using the face normals of the surrounding faces.

Gouraud interpolates the colour, phong interpolates the normals.

Attenuation

inverse square is physically correct, but looks wrong because real lights are not single points as we usually use in describing a scene, and

For now I assume that all polygons are triangles. We can store the normal per polygon. This will reneder this polygon, but most of the time the polygon model is just an approximation of some smooth surface, so what we really want to do is use vertex normals and interpolate them for the polygon.

Ray Tracing

For each pixel on the screen shoot out a ray and bounce it around the scene. The same as shooting rays from the light sources, but only very few would make it into the camera so its not very efficient.

Each object in the scene must provide an intersection(Line2D) function and a normal (Point3D) function

Ray Tree

Nodes are intersections of a light ray with an object. Can branch intersections for reflected/refracted rays. The primary ray is the original ray and the others are secondary rays.

Shadows

Can do them using ray tracing, or can use shadow maps along with the Z buffer. The key to shadow maps is to render the scene from the light's perspective and save the depths in the Z buffer. Then can compare this Z value to the transformed Z value of a candidate pixel.

==============

Rasterisation

Line Drawing

DDA

Bresenham

We use Bresenham's algorithm for drawing lines this is just doing linear interpolation, so we can use Bresenham's algorithm for other tasks that need linear interpolation.

Polygon Filling

Scan line Algorithm

The Active Edge List (AEL) is initially empty and the Inactive Edge List (IEL) initially contains all the edges. As the scanline crosses an edge it is moved from the IEL to the AEL, then after the scanline no longer crosses that edge it is removed from the AEL.

To fill the scanline,

Its really easy to fill a triangle, so an alternative is to split the polygon into triangles and just fill the triangles.

===============

Anti-Aliasing

Ideally a pixel's colour should be the area of the polygon that falls inside that pixel (and is on top of other polygons on that pixel) times the average colour of the polygon in that pixel region then multiply with any other resulting pixel colours that you get from other polygons in that pixel that's not on top of any other polygon on that pixel.

Aliasing Problems

Anti-Aliasing

In order to really understand this anti-aliasing stuff I think you need some basic understanding of how a standard scene is drawn. When using a polygon rendering method (such as is done with most real time 3D), you have a framebuffer which is just an area of memory that stores the RGB values of each pixel. Initially this framebuffer is filled with the background colour, then polygons are drawn on top. If your rending engine uses some kind of hidden surface removal it will ensure that the things that should be on top are actually drawn on top.

Using the example shown (idea from http://cgi.cse.unsw.edu.au/~cs3421/wordpress/2009/09/24/week-10-tutorial/#more-60), and using the rule that if a sample falls exactly on the edge of two polygons, we take the pixel is only filled if it is a top edge of the polygon.
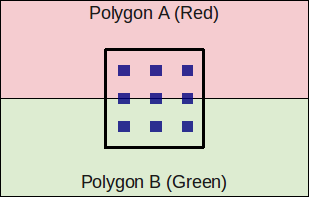
Anti-Aliasing Example Case. The pixel is the thick square, and the blue dots are samples.

No Anti-Aliasing

With no anti-aliasing we just draw the pixel as the colour of the polygon that takes up the most area in the pixel.

Pre-Filtering

Post-Filtering

Can use adaptive supersampling. If it looks like a region is just one colour, don't bother supersampling that region.

OpenGL

Often the graphics card will take over and do supersamling for you (full scene anti aliasing).

To get OpenGL to anti-alias lines you need to first tell it to calculate alpha for each pixel (ie. the ratio of non-filled to filled area of the pixel) using, glEnable(GL_LINE_SMOOTH) and then enable alpha blending to apply this when drawing using,

glEnable(GL_BLEND);
glBlendFunc(GL_SRC_ALPHA, GL_ONE_MINUS_SRC_ALPHA);

You can do post-filtering using the accumulation buffer (which is like the framebuffer but will apply averages of the pixels), and jittering the camera for a few times using accPerspective.

Anti-Aliasing Textures

A texel is a texture pixel whereas a pixel in this context refers to a pixel in the final rendered image.

When magnifying the image can use bilinear filtering (linear interpolation) to fill the gaps.

Mip Mapping

Storing scaled down images and choose closes and also interpolate between levels where needed. Called trilinear filtering.

Rip Mapping helps with non uniform scaling of textures. Anisotropic filtering is more general and deals with any non-linear transformation applied to the texture

Double Buffering

We can animate graphics by simply changing the framebuffer, however if we start changing the framebuffer and we cannot change it faster than the rate the screen will display the contents of the frame buffer, it gets drawn when we have only changed part of the framebuffer. To prevent this, we render the image to an off screen buffer and when we finish we tell the hardware to switch buffers.

Can do on-demand rendering (only refill framebuffer when need to) or continuois rendeing (draw method is called at a fixed rate and the image is redrawn regardless of whether the image needs to be updated.)

LOD

Mip Mapping for models. Can have some low poly models that we use when far away, and use the high res ones when close up.

Animation

Key-frames and tween between them to fill up the frames.

===============

Shaders

OpenGL 2.0  using GLSL will let us implement out own programs for parts of the graphics pipeline particularly the vertex transformation stage and fragment texturing and colouring stage.

Fragments are like pixels except they may not appear on the screen if they are discarded by the Z-buffer.

Vertex Shaders

Fragment Shaders

set gl_FragColor.

Tags: comp3421, computing, graphics.
COMP3421 - Lec 2 - Transformations
23rd August 2009

Homogeneous Coordinates

Interestingly we can use the extra dimension in homogeneous coordinates to distinguish a point from a vector. A point will have a 1 in the last component, and a vector will have a 0. The difference between a point and a vector is a bit wish washy in my mind so I'm not sure why this distinction helps.
Transforming a Point

Say we have the 2D point $latex (x, y)$. This point as a column vector in homogeneous coordinates is $latex \begin{pmatrix} x \ y \ 1 \end{pmatrix}$. For a multiplication between this vector and a transformation matrix (3 by 3) to work we need to do the matrix times the vector (in that order) to give the translated vector, $latex Av = v'$.

Combining Transformations

Say we want to do a translation then a rotation (A then B) on the point x. First we must do $latex Ax = x'$, then $latex B(x')$. That is $latex BAx$. The order is important as matrix multiplication in not commutative, ie. $latex AB \ne BA$ (just think a translation then a rotation is not necessarily the same as a rotate then a move (by the same amounts)). If we do lots of transformations we may get something like $latex DCBAx$, this is in effect doing transformation A then B then C then D. (Remember matrix multiplication is associative, i.e. $latex (AB)C = A(BC)$).

As a side note, if you express your point as a row vector (eg. $latex \begin{pmatrix} x & y & z & 1\end{pmatrix}$), then to do a transformation you must do $latex xA$ (where x is the point/row vector). In this case $latex xABC$ is equivalent to doing transformation A on point x, then transformation B then C (apparently this is how DirectX works).

Affine Transformations

Affine transformations are a special kind of transformation. They have a matrix form where the last row is [0 ... 0 1]. An affine transformation is equivalent to a linear transformation followed by a translation. That is, $latex \begin{bmatrix} \vec{y} \ 1 \end{bmatrix} = \begin{bmatrix} A & \vec{b} \ \ 0, \ldots, 0 & 1 \end{bmatrix} \begin{bmatrix} \vec{x} \ 1 \end{bmatrix}$ is the same as $latex \vec{y} = A \vec{x} + \vec{b}$.

Something interesting to note is, the inverse transformation of an affine transformation is another affine transformation, whose matrix is the inverse matrix of the original. Also an affine transformation in 2D is uniquely defined by its action on three points.

From page 209 of the text (Hill, 2006), affine transformations have some very useful properties.

1. Affine Transformations Preserve Affine Combinations of Points

For some affine transformation T, points P1 and P2, and real's a1 and b1 where a1 + b1 = 1,

$latex T(a_1P_1 + a_2P_2) = a_1T(P_1)+a_2T(P_2)$

2. Affine Transformations Preserve Lines and Planes

That is under any affine transformation lines transformed are still lines (they don't suddenly become curved), similarly planes that are transformed are still planes.

3. Parallelism of Lines and Planes is Preserved

"If two lines or planes are parallel, their images under an affine transformation are also parallel." The explanation that Hill uses is rather good,

Take an arbitrary line A + bt having direction b. It transforms to the line given in homogeneous coordinates by M(A + bt) = MA + (Mb)t, this transformed line has direction vector Mb. This new direction does not depend on point A. Thus two different lines $latex A_1 + \mathbf{b}t$ and $latex A_2 + \mathbf{b}t$ that have the same direction will transform into two lines both having the direction $latex M\mathbf{b}$, so they are parallel. The same argument can be applied to planes and beyond.

4. The Columns of the Matrix Reveal the Transformed Coordinate Frame

Take a generic affine transformation matrix for 2D,

$latex M = \begin{pmatrix}a & b & c\ d & e & f\ 0 & 0 & 1 \end{pmatrix}$

The first two columns, $latex \mathbf{m_1} = \begin{pmatrix}a \ d\ 0\end{pmatrix}$ and $latex \mathbf{m_2} = \begin{pmatrix}b \ e\ 0\end{pmatrix}$, are vectors (last component is 0). The last column $latex \begin{pmatrix}c \ f\ 1\end{pmatrix}$ is a point (last component is a 1).

Using the standard basis vectors $latex \mathbf{i} = \begin{pmatrix}1 \ 0\ 0\end{pmatrix}$, $latex \mathbf{j} = \begin{pmatrix}0 \ 1\ 0\end{pmatrix}$ with origin $latex \phi = \begin{pmatrix}0 \ 0\ 1\end{pmatrix}$, notice that i transforms to the vector $latex \mathbf{m_1}$. $latex \mathbf{m_1} = M\mathbf{i}$. Similarily for $latex \mathbf{j}$ and $latex \phi$.

5. Relative Ratios are Preserved

6. Area's Under an Affine Transformation

Given an affine transformation as a matrix M,

$latex \frac{\mbox{area after transformation}}{\mbox{area before transformation}} = |\mbox{det} M|$

7. Every Affine Transformation is Composed of Elementary Operations

Every affine transformation can be constructed by a composition of elementary operations (see below). That is,

$latex M = (\mbox{shear})(\mbox{scale})(\mbox{rotation})(\mbox{translation})$

For a 2D affine transformation M. In 3D,

$latex M = (\mbox{scale})(\mbox{rotation})(\mbox{shear}1)(\mbox{shear}2)(\mbox{translation})$

Rotations

Euler's theorem: Any rotation (or sequence of rotations) about a point is equivalent to a single rotation about some coordinate axis through that point. Pages 221-223 of Hill give a detailed explanation of this, as well as the equations to go from one form to the other.
W2V (Window to Viewport Mapping)

A simplified OpenGL pipeline applies the modelview matrix, projection matrix, clipping, then the viewport matrix. The viewport matrix is the window to viewport map.

The window coordinate system is somewhere on the projection plane. These coordinates need to be mapped to the viewport (the area on the screen)

References

F.S. Hill, et al. (2006). Computer Graphics using OpenGL. Second Ed.

Tags: comp3421, graphics.
COMP3421 - Lec 1 - Colour
22nd August 2009

Colour

Pure spectral light, is where the light source has just one single wavelength. This forms monochromatic (or pure spectral) colours.

spectrum

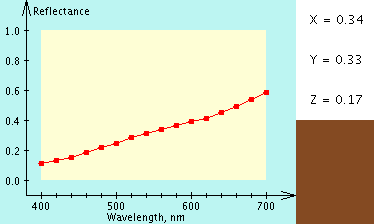
However mostly light is made up of light of multiple wavelengths so you end up with a distribution of wavelengths. You could describe colour by this frequency distribution of wavelengths. For example brown is not in the spectrum, but we can get brown from this distribution of different light wavelengths,

[caption id="attachment_648" align="aligncenter" width="374" caption="Spectral Distribution for a Brown Colour (http://www.cs.rit.edu/~ncs/color/a_spectr.html)"]brown_distribution[/caption]

We could describe colour like this (as opposed to RGB) but human eyes perceive many different distributions (spectral density functions) as the same colour (that is they are indistinguishable when placed side by side). The total power of the light is known as its luminance which is given by the area under the entire spectrum.

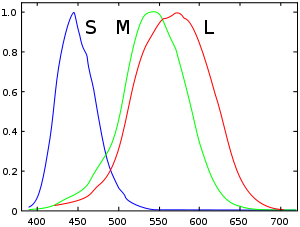
The human eye has three cones (these detect light), the short, medium and long cones (we have two kinds of receptors cones and rods, rods are good for detecting in low light but they cannot detect colour or fine detail). The graph below shows how these three cones respond to different wavelengths.

[caption id="attachment_649" align="aligncenter" width="300" caption="(Source: http://en.wikipedia.org/wiki/File:Cones_SMJ2_E.svg)"]300px-Cones_SMJ2_E.svg[/caption]

So the colour we see is the result of our cones relative responses to RGB light. Because of this the human eye cannot distinguish some distributions that are different, to the eye they appear as the same color, hence you don't need to recreate the exact spectrum to create the same sensation of colour. We can just describe the colour as a mixture of three colours.

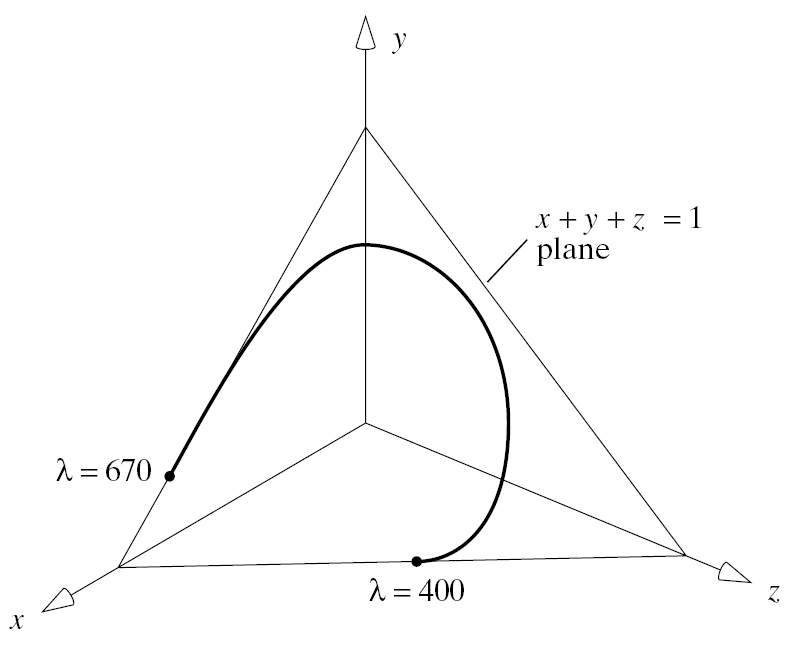
There are three CIE standard primaries X, Y, Z. An XYZ colour has a one to one match to RGB colour. (See http://www.cs.rit.edu/~ncs/color/t_spectr.html for the formulae.)

Not all visible colours can be produced using the RGB system.

=====

Where S, P, N are spectral functions,

if S = P then N + S = N + P (ie. we can add a colour to both sides and if they were perceived the same before, they will be percieved the same after)

On one side you project $latex S(\lambda)$ on the other you project combinations of A, B and C to give $latex aA(\lambda) + bB(\lambda) + cC(\lambda)$

By experimentation it was shown that to match any pure spectral colour $latex \lambda$ you needed the amounts of RGB shown,

=====

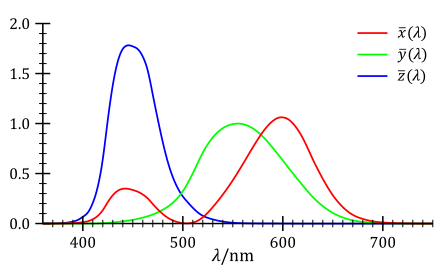
To detirmine the XYZ of a colour from its spectral distribution  you need to use the following equations,

$latex X= \int_0^\infty I(\lambda)\,\overline{x}(\lambda)\,d\lambda$ $latex Y= \int_0^\infty I(\lambda)\,\overline{y}(\lambda)\,d\lambda$ $latex Z= \int_0^\infty I(\lambda)\,\overline{z}(\lambda)\,d\lambda$

Where the $latex \overline{x}$, $latex \overline{y}$ and $latex \overline{z}$ functions are defined as,

[caption id="attachment_705" align="aligncenter" width="446" caption="The CIE 1931 XYZ colour matching functions. (Source: http://commons.wikimedia.org/wiki/File:CIE_1931_XYZ_Color_Matching_Functions.svg CC-BY-SA)"]The CIE 1931 XYZ color matching functions.[/caption]

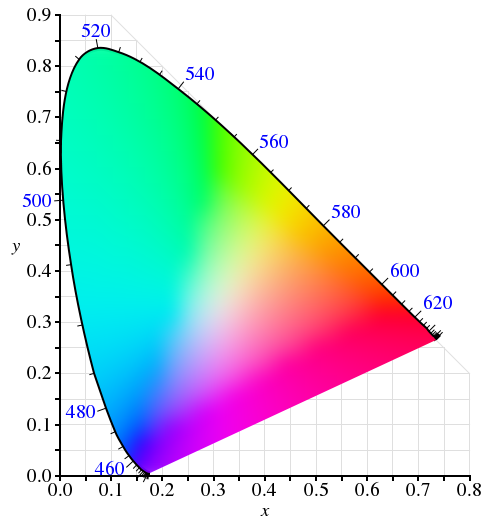
CIE Chromaticity Diagram

We can take a slice of the CIE space to get the CIE chromaticity diagram.

(Source: Hill)Source: http://en.wikipedia.org/wiki/File:CIE1931xy_blank.svg

RGB

fsc_stego_kessler_fig02(r, g, b) is the amount of red, green and blue primaries.

CMY

CMY is a subtractive colour model (inks and paint works this way). (c,m,y) = (1,1,1) - (r,g,b).

But inks don't always subtract well so printers usually use a black ink as well using CMYK.

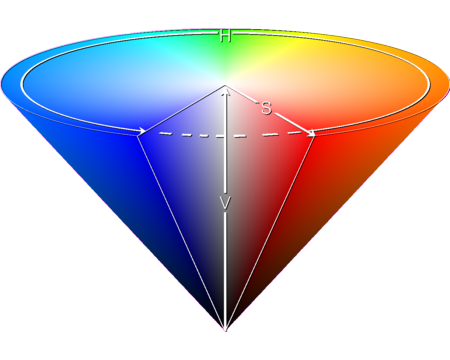
HSV

The HSV colour model is really good for allowing the user to select a colour as they choose the hue (colour), saturation (how rich the colour is) and value (how dark the colour is).

[caption id="attachment_712" align="aligncenter" width="450" caption="HSV Colour Cone"]HSV Colour Cone[/caption]

Gamut

Gamut is the range of colours available which is represented as a triangle in the CIE Chromacity diagram. Different devices have different gamuts (for instance the printer and LCD monitor).

Tags: comp3421, graphics.
A problematic HSC ITG Question (2001 Q5a)
11th March 2009

I discovered this back in 2007 when I was preparing for my HSC exams.

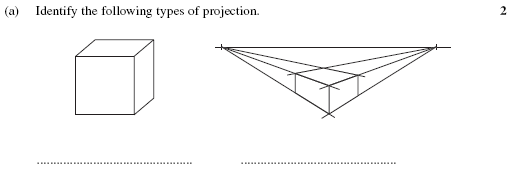
Here is the question (from the exam paper here),

[caption id="attachment_310" align="aligncenter" width="450" caption="2001 HSC ITG Q5a"]2001 HSC ITG Q5a[/caption]

Firstly I think this question is beyond the scope of the syllabus. The only relevant dot point says,

"Pictorial drawing
  • isometric
  • perspective (mechanical and measuring point)"

There is no reference to oblique drawing or oblique projection (this was the official answer).

Secondly, and more importantly the examiners say in their Notes from the Marking Centre, "This part was generally well answered; candidates had little trouble in identifying oblique and perspective projection."

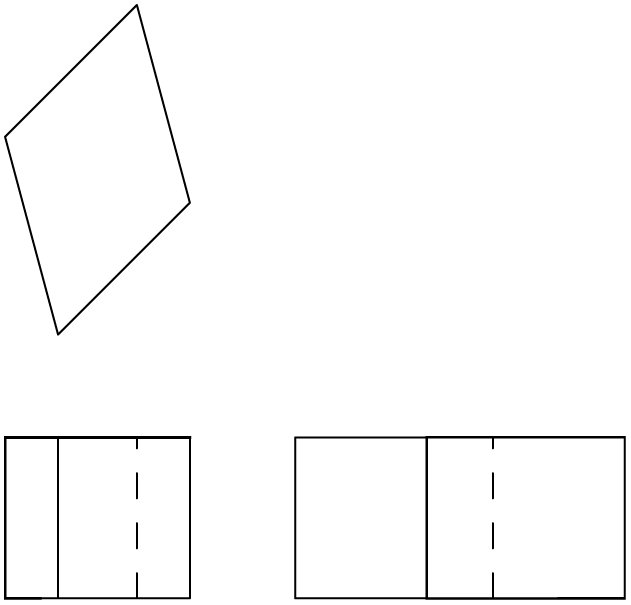
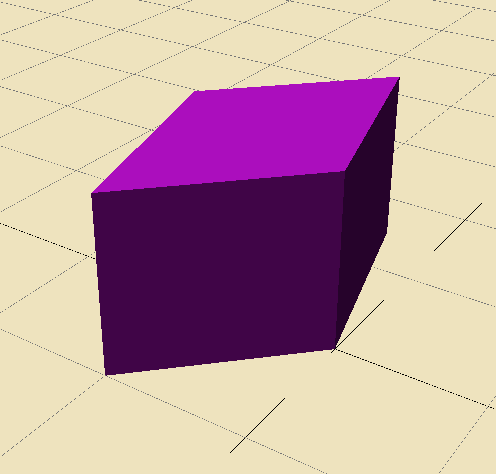
They claim that the first one is oblique projection, yet with just the information given its impossible to determine the projection used. For example the drawing given could be of a cube drawn in oblique projection or it could be of another object (shown below) in isometric projection, or some other object in some other projection. There are infinity different projections that it could have been drawn in.

[caption id="attachment_311" align="aligncenter" width="450" caption="An object (I call a Vube) shown in 3rd angle orthogonal which when drawn in isometric looks like a cube in oblique."]An object (I call a Vube) shown in 3rd angle orthogonal which when drawn in isometric looks like a cube in oblique.[/caption]

[caption id="attachment_312" align="aligncenter" width="450" caption="Vube shown in perspective."]Vube shown in perspective.[/caption]

The exam paper should have specified that the object in question is a cube.

Tags: graphics, hsc, industrial technology, technical drawing.
The Mathematics Behind Graphical Drawing Projections in Technical Drawing
15th November 2008

In the field of technical drawing, projection methods such as isometric, orthogonal, perspective are used to project three dimensional objects onto a two dimensional plane so that three dimensional objects can be viewed on paper or a computer screen. In this article I examine the different methods of projection and their mathematical roots (in an applied sense).

The approach that seems to be used by Technical Drawing syllabuses in NSW to draw simple 3D objects in 2D is almost entirely graphical. I don't think you can say this is a bad thing because you don't always want or need to know the mathematics behind the process, you just want to be able to draw without thinking about this. However to have an appreciation of what's really happening the mathematical understanding is a great thing to learn.

Many 3D CAD/CAM packages available on the market today (such as AutoCAD, Inventor, Solidworks, CATIA, Rhinoceros) can generate isometric, three point perspective or orthogonal drawings from 3D geometry, however from what I've seen they can't seem do other projections such as dimetric, trimetric, oblique, planometric, one and two point perspective. Admittedly I don't think these projections are any use or even needed, but when your at high school and you have to show that you know how do to oblique, et al. it can be a problem when the software cannot do it for you from your 3D model. (So I actually wrote a small piece of software to help with this in this article). But to do so, I needed to understand the mathematics behind these graphical projections. So I will try to explain that here.

The key idea is to think of everything having coordinates in a coordinate system (I will use the Cartesian system for simplicity). We can then express all these projections as mathematical transformations or maps. Like a function, you feed in the 3D point, and then you get out the projected 2D point. Things get a bit arbitrary here because an isometric view is essentially exactly the same as a front view. So we keep to the convention that when we assign the axis of the coordinate system we try to keep the three planes of the axis parallel to the three main planes of the object.

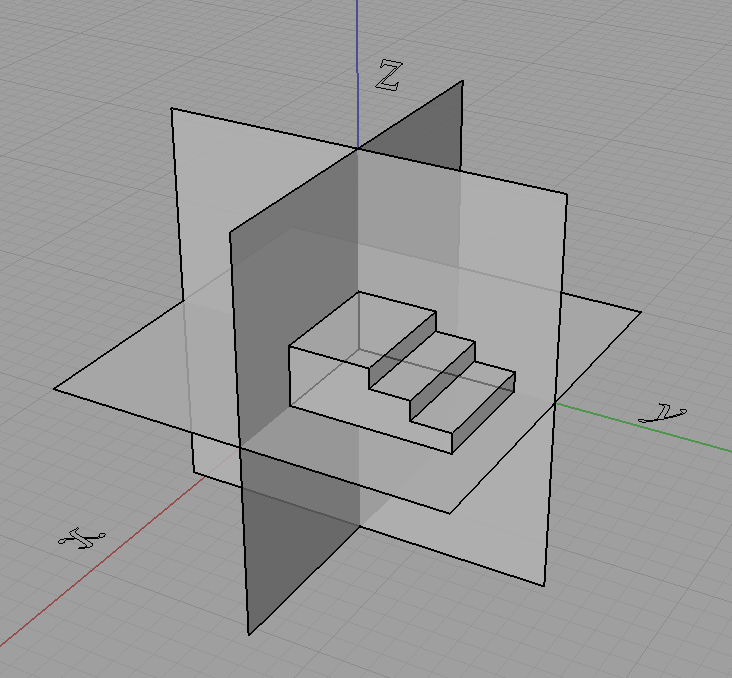
[caption id="attachment_107" align="aligncenter" width="450" caption="The three "main" planes of the object are placed parallel to the three planes of the axis. This is how we will choose our axis in relation to the object."]The three "main" planes of the object are placed parallel to the three planes of the axis. This is how we will choose our axis in relation to the object.[/caption]

We will not do this though,

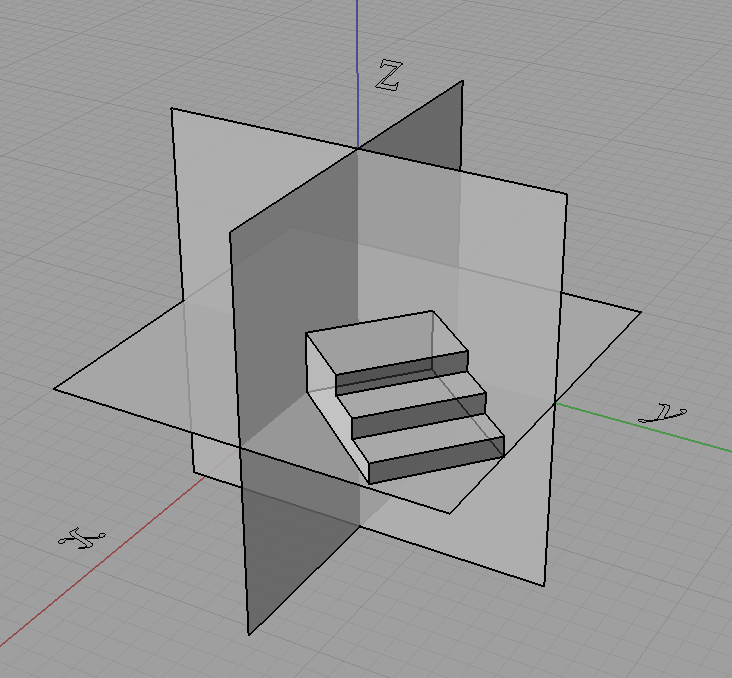
[caption id="attachment_108" align="aligncenter" width="450" caption="We will not choose it like this..."]We will not choose it like this...[/caption]

[caption id="attachment_109" align="aligncenter" width="450" caption="...or this."]...or this.[/caption]

In fact doing something like that shown just above with the object rotated is how we get projections like isometric.

Now what we do is take the coordinates of each point and "transform" them to get the projected coordinates, and join these points with lines where they originally were. However we can only do this for some kinds of projections, indeed for all the ones I have mentioned in this post this will do but only because these projections have a special property. They are linear maps (affine maps also hold this property and are a superset of the set of linear maps) which means that straight lines in 3D project to straight lines in 2D.

For curves we can just project a lot of points on the curve (subdivide it) and then join them up after they are projected. It all depends what our purpose is and if we are applying it practically. We can generate equations of the projected curves if we know the equation of the original curve but it won't always be as simple. For example circles in 3D under isometric projection become ellipses on the projection plane.

Going back to the process of the projection, we can use matrices to represent these projections where

$latex \begin{pmatrix}x'\\ y'\\ z'\end{pmatrix} = \begin{pmatrix}a&b&c\\ d&e&f\\ g&h&i\end{pmatrix}\begin{pmatrix}x\\ y\\ z\end{pmatrix}$

is the same as,

$latex x' = ax+by+cz\\ y' = dx+ey+fz\\ z' = gx+hy+iz.$

We call the 3 by 3 matrix above as the matrix of the projection.

Knowing all this, we can easily define orthogonal projection as you just take two of the dimensions and cull the third. So for say an orthographic top view the projection matrix is simply,

$latex \begin{pmatrix}1&0&0\\ 0&1&0\\ 0&0&0\end{pmatrix}.$

Now we want a projection matrix for isometric. One way would be to do the appropriate rotations on the object then do an orthographic projection, we can get the projection matrix by multiplying the matrices for the rotations and orthographic projection together. However I will not detail that here. Instead I will show you another method that I used to describe most of the projections that I learnt from high school (almost all except perspectives).

I can describe them as well as many "custom" projections in terms of what the three projected axis look like on the projection plane. I described them all in terms of a scale on each of the three axis, as well as the angle two of the axis make with the projection plane's horizontal.

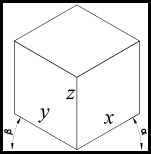
[caption id="attachment_112" align="aligncenter" width="151" caption="Projection attributes described in terms of the projected axis."]Projection attributes described in terms of the projected axis.[/caption]

Using this approach we can think of the problem back in a graphical perspective of what the final projected drawing will look like rather than looking at the mathematics of how the object gets rotated prior to taking an orthographic projection or what angle do the projection lines need to be at in relation to the projection plane to get oblique, etc. Note also that the x, y, z in the above diagram are the scales of the x, y, z axis respectively. So we can see in the table below that we can now describe these projections in terms of a graphical approach that I was first taught.

Projection α (alpha) β (beta) Sx Sy Sz
Isometric 30° 30° 1 1 1
Cabinet Oblique 45° 0.5 1 1
Cavalier Oblique 45° 1 1 1
Planometric 45° 45° 1 1 1

Now all we need is a projection matrix that takes in alpha, beta and the three axes scale's and does the correct transformation to give the projection. The matrix is,

$latex \begin{bmatrix}x'\\y'\\z'\\1\end{bmatrix}=\begin{bmatrix}S_x\cos\alpha&-S_y\cos\beta&0&0\\ S_x\sin\alpha&S_y\sin\beta&S_z&0\\ 0&0&0&0\\ 0&0&0&1\end{bmatrix}\begin{bmatrix}x\\y\\z\\1\end{bmatrix}$

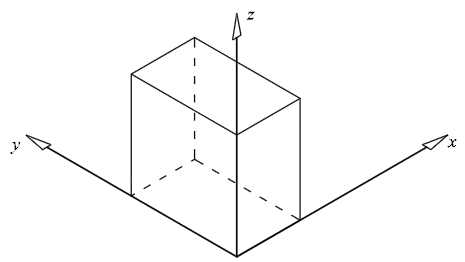
Now for the derivation. First we pick a 3D Cartesian coordinate system to work with. I choose the Z-up Left Hand Coordinate System, shown below and we imagine a rectangular prism in the 3D coordinate system.

[caption id="attachment_114" align="aligncenter" width="450" caption="Block in 3D coordinate system."]Block in 3D coordinate system.[/caption]

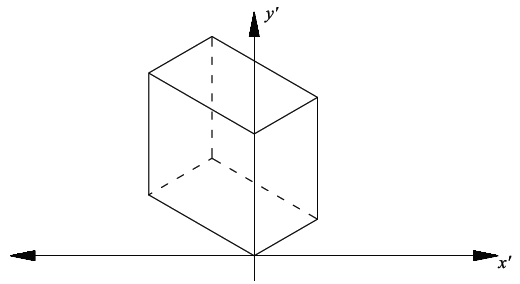
Now we imagine what it would look like in a 2D coordinate system using isometric projection.

[caption id="attachment_115" align="aligncenter" width="450" caption="Block in 2D coordinate system (isometric)."]Block in 2D coordinate system (isometric).[/caption]

As the alpha and beta angles (shown below) can change, and therefore not limited to a specific projection, we need to use alpha and beta in the derivation.

pp-description

Now using these simple trig equations below we can deduce the following.

polar

All the points on the xz plane have y = 0. Therefore the x’ and y’ values on the 2D plane will follow the trig property shown above, so:

$latex x'=x\cos\alpha$ $latex y' = z + y\sin\alpha$

However not all the points lie on the xz plane, y is not always equal to zero. By visualising a point with a fixed x and z value but growing larger in y value, its x’ will become lower, and y’ will become larger. The extent of the x’ and y’ growth can again be expressed with the trig property shown, and this value can be added in the respective sense to obtain the final combined x’ and y’ (separately).

$latex x'=x\cos\alpha -y\cos\beta$ $latex y' = z + x \sin \alpha + y \sin \beta$

If y is in the negative direction then the sign will automatically change accordingly. The next step is to incorporate the scaling of the axes. This was done by replacing the x, y & z with a the scale factor as a multiple of the x, y & z. Hence,

$latex x'=S_x x\cos\alpha -S_y y\cos\beta$ $latex y' = S_z z + S_x x\sin\alpha + S_y y \sin \beta$

This can now easily be transferred into matrix form as shown at the start of this derivation or left as is.

References: Harvey, A. (2007). Industrial Technology - Graphics Industries 2007 HSC Major Project Management Folio. (Link)

Tags: graphics, mathematics, projections, technical drawing.
The New Industrial Technology Syllabus (HSC 2010)
18th October 2008

Only a couple of days ago the new Industrial Technology Syllabus to be implemented for the HSC in 2010 was released. It appears they finally weaved out a lot of the bugs making it much clearer and much less ambiguous. You wouldn't think it would take them six years to do this, but turns out it did. The syllabus was not redone, rather just amended.

As for the changes... Well I guess the biggest change is the removal the Building and Construction, and Plastics Industries. I can understand the removal of Building and Construction as there is already a Construction VET course available, it's always a shame to see a subject go so bad news for plastics enthusiasts, although it's understandable when it gathers next to zero candidates each year.

The four sections of the course,

A. Industry study B. Design and management C. Workplace communication D. Industry-specific content and production

have been changed to,

A. Industry Study B. Design, Management and Communication C. Production D. Industry Related Manufacturing Technology.

They have also separated a lot of the preliminary content from the HSC content. This makes a lot of sense previously it appeared that you were supposed to learn the exact same content in both years. Also they have listed "Students learn about" and "Students learn to" dot points for the Major Work.

The most interesting (to me at least) changes were to that of the Graphics Industries specific content (note that they are now called technologies (collectively as focus areas) rather than industries e.g. you would now say the focus area Graphics Technologies). I support many, if not all of these changes although you get the feeling that this is what the original syllabus writers meant to be in the syllabus but simply forgot about and only now noticed that it was missing. I say this because much of the content from the previous HSC exams was based on material and content that was absent from the syllabus but has now been placed in the 2010 one. The order and categorising of this material has been redone and is much cleaner and nicer now.

For instance we now have oblique drawings (with references to cabinet and cavalier) mentioned in the syllabus along with,

The Multimedia Technologies section also is much better now. It now contains the study of different types of fonts, formatting features, page layout elements for publications, features of graphics such as file formats and resolution, methods of obtaining images, image manipulation and editing, audio features such as sampling rate, file formats, analogue vs. digital, video features like frame rate compression, editing, compositing, animation techniques both 2D and 3D with references to motion capture, virtual reality, along with the world wide web, intellectual property, and the list goes on and on... Don't just go by my description here go read the syllabus document, you will be very pleased with the changes or should I say additions.

If I were doing my HSC again, I know for sure I would have a very hard time choosing between multimedia and graphics technologies. They used to be together as one industry back pre 1999, although I must admit it is too much for someone who has done neither before to master both as one 2U subject. I wish you could do both, but they can't allow that because the industry study, design and communication parts would be too common.

As for the common sections (Industry Study, Design and Management and Communication) the improvements here were good too with much more detail. But it's not just the fact that the document is more detailed, but these details are what you would expect. They are in the right direction and are things that should be included. The Design section reinforces that the major project is not just about production of something, but the design aspects that go into it. The only problem I currently have is where is this design meant to be applied. It should be in the most obvious place, but the way the syllabus refers to production makes this slightly unclear. Timber Products and Furniture Technologies would look at the design aspects of the timber products or furniture product that they were producing. But if you were doing Graphics Technologies, your product is a series of drawings and perhaps related media such as flythoughs, etc. Do you look at the design of these drawings, I would say not, rather you should apply design techniques to the thing you are drawing, whether that be a product, building or a mechanical system. I don't think this has been cleared up.

I haven't been up to date with all things related here, so I may have missed some things. But one thing is for sure that I congratulate the Board for their work on this, and I'm sure many HSC students will benefit immensely from this revised syllabus. The syllabus is in much better shape now. As for the content, well I could argue that the material from the stage 5 graphics technology syllabus is more advanced than that of the stage 6 syllabus, and this should not happen. But as long as the stage 5 course is not a prerequisite, and as long as you have less time to cover industry specific content from the stage 6 course than that of the stage 5 course, there is little that can be done.

(PS. As a self advertisment, my 2007 HSC Industrial Technology Graphics Industries Major Work in its entirety can be downloaded from my site here, http://andrew.harvey4.googlepages.com/)

Tags: education, graphics, hsc, industrial technology.
(x,y,z,w) in OpenGL/Direct3D (Homogeneous Coordinates)
29th September 2008

I always wondered why 3D points in OpenGL, Direct3D and in general computer graphics were always represented as (x,y,z,w) (i.e. why do we use four dimensions to represent a 3D point, what's the w for?). This representation of coordinates with the extra dimension is know as homogeneous coordinates. Now after finally getting formally taught linear algebra I know the answer, and its rather simple, but I'll start from the basics.

Points can be represented as vectors, eg. (1,1,1). Now a common thing we want to do in computer graphics is to move this point (translation). So we can do this by simply adding two vectors together,

$latex \begin{pmatrix}x'\\y'\\z'\end{pmatrix} = \begin{pmatrix}x\\y\\z\end{pmatrix} + \begin{pmatrix}a\\b\\c\end{pmatrix} = \begin{pmatrix}x + a\\y + b\\z + c\end{pmatrix}.$

If we wanted do some kind of linear transformation such as rotate about the origin, scale about the origin, etc, then we could just multiply a certain matrix with the point vector to obtain the image of the vector under that transformation. For example,

$latex \begin{pmatrix}x'\\ y'\\ z' \end{pmatrix} = \begin{pmatrix}\cos \theta &-\sin \theta &0\\ \sin \theta &\cos \theta &0\\ 0&0&1\end{pmatrix} \begin{pmatrix}x\\ y\\ z\end{pmatrix}$

will rotate the vector (x,y,z) by angle theta about the z axis.

However as you may have seen you cannot do a 3D translation on a 3D point by just multiplying a 3 by 3 matrix by the vector. To fix this problem and allow all affine transformations (linear transformation followed by a translation) to be done by matrix multiplication we introduce an extra dimension to the point (denoted w in this blog). Now we can perform the translation,

$latex \mathbb{R}^2 : (x,y) \to (x+a, y+b)$

by a matrix multiplication,

$latex \begin{pmatrix}1 & 0 & a\\ 0 & 1 & b\\ 0 & 0 & 1\end{pmatrix} \begin{pmatrix}x\\ y\\ 1\end{pmatrix} = \begin{pmatrix}x + a\\ y + b\\ 1 \end{pmatrix}.$

We need this extra dimension for the multiplication to make sense, and it allows us to represent all affine transformations as matrix multiplication.

REFERENCES: Homogeneous coordinates. (2008, September 29). In Wikipedia, The Free Encyclopedia. Retrieved 04:33, September 29, 2008, from http://en.wikipedia.org/w/index.php?title=Homogeneous_coordinates&oldid=241693659

Tags: graphics, math1231, mathematics, projections.

RSS Feed