avatar tianjara.net | blog icon Andrew Harvey's Blog

Entries from February 2010.

A Daylight Chart for Sydney
23rd February 2010

Alright I'm here doing something I told myself I wouldn't, that is double post (you would have noticed this if you subscribe to my Github RSS feed). But I feel that I have a wider audience here than on my Github RSS feed.

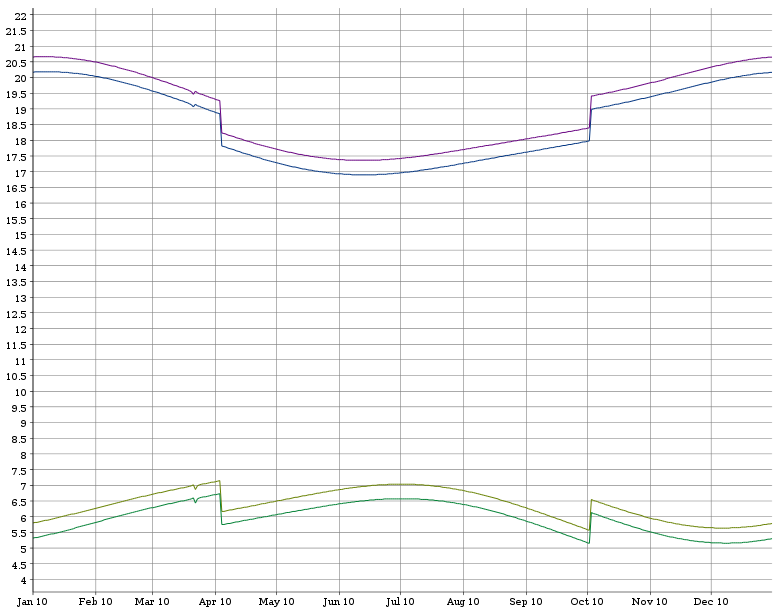
Anyway I recently put together a daylight chart using some existing tools. You can see it here. Here is the static image version (the one in the link is drawn with JavaScript and has some interactivity). This is for 2010 in Sydney in Sydney's timezone.

Chart showing sunrise and sunset times for Sydney (Civil Twilight and the other common measurement of sunrise and sunset are shown).

PS. I don't know what those jumps in March are, look into the DateTime::Event::Sunrise perl module for the answer.

No tags
Australian States Map/Graph API
19th February 2010

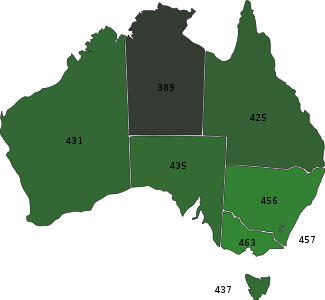
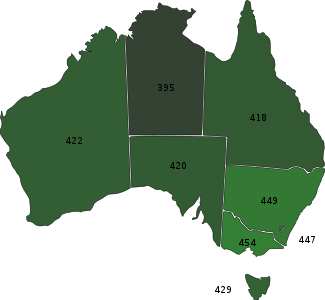
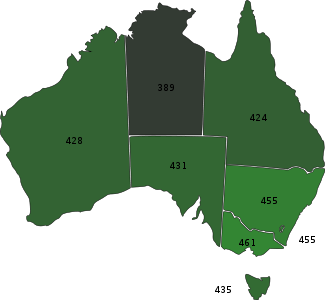
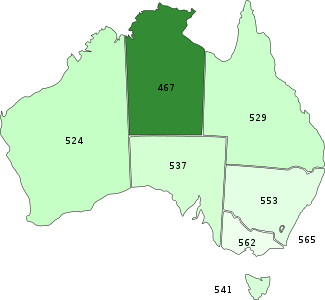
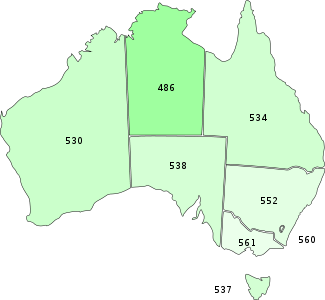
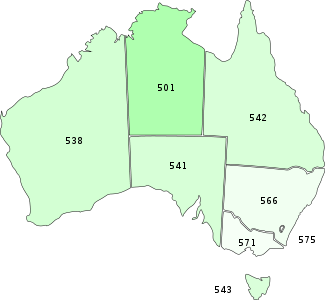
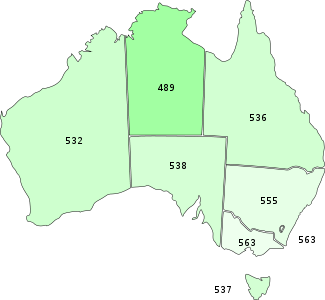
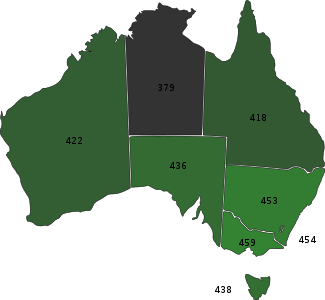
I've managed to do a couple things all in one here. I've made use of some Geoscience Australia Creative Commons licensed material, in a nice little program with a web API, and I've aggregated some data from the myschool scraper and parser. Putting them all together gives some nice images like this.

The program for generating these images basically takes an SVG template file with placeholder markers and then fills these values based on the CGI parameters. The API is fairly simple so one should be able to work out how to use it from the example in the README file. Here are the files I used to make the graphs (and the svg versions as Wordpress.com won't let me upload them to here).

ps. This gets cut off when viewing it from the default web interface of this blog, use print preview or even better look at the RSS feed to see the cut off parts. Also I tried to ensure the accuracy of the data, but I cannot be 100% sure that there are no bugs, in fact there are discrepancies with the averages I get from my scrape of myschool and the averages provided in the report on the NPLAN website. The numbers I get seem to be consistent (ie. the state rankings seem mostly the same), but nonetheless not exactly the same as those reported in the report. Although I would be very surprised if all the numbers I got were exactly the same as in the report. I mainly did this to use map/graph code I wrote, so if you really care about how certain state averages compare in these tests look at the reports on the NPLAN website.

The lighter the colour the higher the number.

Primary

2008 2009
Literacy
Numeracy
All

Secondary

2008 2009
Literacy
Numeracy
All
Tags: computing, education, graphics.
myschool NPLAN Data (and NSW's Attempt at Censorship)
18th February 2010

Following up from my previous post, I have made improvements to the code, and I now have all the NPLAN data too. There are also some data files so you don't need to run the scraper and parser which hopefully this makes the data more usable and to a wider range of people. Now that I have the NPLAN data you can compare schools in terms of their (I assume the numbers are averages) test results. I was going to put in the repository some tables mashing together some of the data in the database, but I've had to research about a silly NSW law first. I'm not exactly sure what I can publish and what the implication of that would be (so best make your own league tables and possibly publish them if you want). The NSW law says,

A person must not, in a newspaper or other document that is publicly available in this State: (a) publish any ranking or other comparison of particular schools according to school results, or, (b) identify a school as being in a percentile of less than 90 per cent in relation to school results.

The folks at the Sydney Morning Herald seem to think that "Published online the same tables infringe no law; printed on these pages they are illegal." This is not what I interpret the law as. Publishing online means that the document is available for access from NSW. However I am confident I can get around this by not hosting anything myself and not hosting in Australia. For this I rely on the great services provided by wordpress.com (Automattic, Inc.) and/or github.com (GitHub, Inc.). Hopefully these US companies wouldn't cave into any threats from the Australian government.

This section of the law carries a maximum of 50 penalty units. Which is currently a fine of $5500, that is a large enough sum for me to take extra care. This is why I'm still not sure if I should put such lists like schools ordered by certain NPLAN results in the github repository.

By the way, this censorship and damaging law raises the same questions and problems (problems for those that wish to avoid criminal or civil charges) about legal jurisdiction over the internet, the classic example is the "yahoo! nazi paraphernalia" debacle.

Footnote: This SQL query should give you an ordered list of schools based on the 2009 year 9 NPLAN results (but I guess if you can load the database dump you can probably write your own queries...).

SELECT s.name, n.score, sub.state
FROM nplan n, school s, (SELECT distinct pcode, state FROM suburb) sub
WHERE n.school = s.myschool_url 
  AND s.postcode = sub.pcode
  AND n.year = 2009 
  AND n.grade = 9 
  AND n.area = 'numeracy' 
ORDER BY n.score DESC;
Tags: education, law.
Acts not constituting infringements of copyright in works (Australia)
8th February 2010

I post these here for the purpose of future reference and use.

...for purpose of criticism or review

...for purpose of parody or satire

...for the purpose of, or is associated with, the reporting of news by means of a communication...

...for the purposes ... of a report of a judicial proceeding.

They are "Acts not constituting infringements of copyright in works". So I'm just reminding myself of these rights so that any time I wish to use material covered by these, I can just grab the text and link from here and note it next to the copy. Of course this is not really relevant here because this blog is hosted by a US company, but it would be help if I were to one day decide to self host in Australia.


Tags: law.
A Look into the myschool.edu.au Data
7th February 2010

After overcoming a few problems I managed to write a scraper for the myschool.edu.au data. Unfortunately they choose to put data in HTML, so the scraping process may have led my data to have some unknown errors. I publish (see bottom) the scraped data as I believe that per the IceTV v Nine Network [2009] HCA 14 case, any data that my scraper produces as output from the HTML input is not subject to the copyright of the original HTML content (this also means that I cannot publish the HTML pages) and the Telstra Corporation Limited v Phone Directories Company Pty Ltd [2010] FCA 44 case, that the raw data that is scraped is not subject to copyright.

I wish I could bzip2 up all those HTML pages and give them to you just to save your download, because the myschool.edu.au site doesn't compress their pages when I tell them I accept gzip over HTTP, so it took up almost 2GB of quota to download all the HTML pages, oh well.

Some preliminary statistics from the data.

I could report a lot of stats like these above, all you need is a basic knowledge of SQL, but as much as I enjoy working out these stats I find graphs and graphics much more intuitive, so that is up next. Because of the vast dimensions to the data you can make all kinds of graphs so what would be best is a system to draw graphics dynamically which allows the user to decide what is graphed, but this takes more work so that is on the todo list.

I've also looked into doing some heatmaps using the geographical location of the schools, I could have used Google Maps, or I could use OpenStreetMap and libchamplain. Both have pros and cons... But for now I used Google Maps because their API is simple and I've always wanted to experiment with it, the downside is I'm not sure about the copyright of their maps and subsequently any derivative works. This image is just a test showing a dot for each school in the system, but its very easy to change the colour, size and opacity of the dots based on features of the school.

Schools in Sydney Map

Another test (some markers will be missing or in the wrong place, like the ones in NZ!),

[caption id="attachment_1023" align="aligncenter" width="450" caption="Google Earth map showing markers for Australian schools (though not completely accurate). (Copyright notices in image)"]Google Earth map showing markers for Australian schools (though not completely accurate).[/caption]

Source code? http://github.com/andrewharvey/myschool

Don't want to scrape and parse but want the raw data in a usable form? http://github.com/andrewharvey/myschool/tree/master/data_exports/

Extra thought: Currently the code uses Google's API for geting the geolocation of the school, I could use OpenStreetMap for this also, however it would take more investiagtion to determine what tools exist. At the moment all I know is I have an .osm file of Australia, but schools aren't just one dot, they are a polygon so unless I find some other tools which probably exist, I would need to (probably) just use one of the points in the polygon.

Or I could used the Geographic Names Register for NSW, but that is just for NSW... http://www.gnb.nsw.gov.au/__gnb/gnr.zip
Tags: computing, education, politics.

RSS Feed