Point, Line Segment, Square, Cube. But what comes next, what is the equivalent object in higher dimensions? Well it is called a hypercube or n-cube, although the 4-cube has the special name tesseract.
Construction Methods
Before I go on to explain about the elements of hypercubes, let me show you some pictures of some hypercubes. I guess this also raises the question how can you construct these objects. One method is to start with a point. Then stretch it out in one dimension to get a line segment. Then take this line and stretch it out in another dimension perpendicular to the previous one, to get a square. Then take that square and stretch it out in another dimension perpendicular to the previous two to get a cube. This is when your visualisation may hit a wall. Its very hard to then visualise taking this cube and stretching it in another dimension perpendicular to the previous three. However mathematically, this is easy and this is one approach to constructing hypercubes.
[caption id="attachment_55" align="aligncenter" width="297" caption="We place a point in R3."]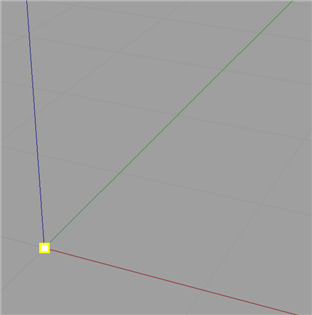 [/caption]
[caption id="attachment_56" align="aligncenter" width="297" caption="...and then stretch the point in one dimension to make a line..."]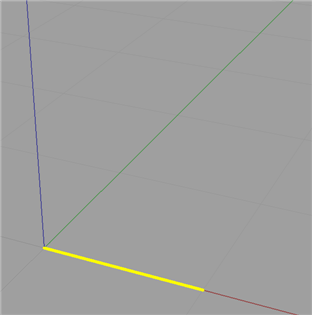 [/caption]
[caption id="attachment_58" align="aligncenter" width="297" caption="...and then we stretch that line in a direction perpendicular to the previous time..."]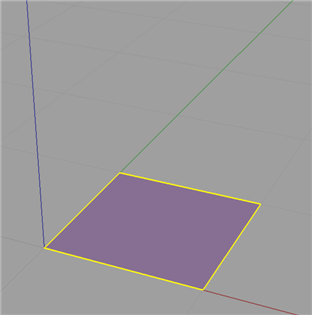 [/caption]
[caption id="attachment_59" align="aligncenter" width="297" caption="...and finally stretch that plane in a direction perpendicular the the previous two times."]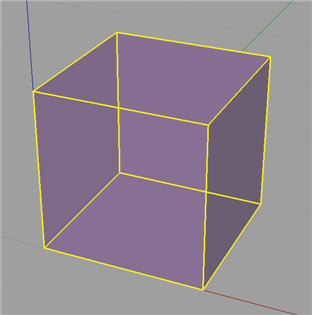 [/caption]
However there is more mathematical and analytical method. You most probably know that these n-cubes have certain elements to them, namely vertices (points), edges (lines), faces (planes), and then in the next dimension up, cells and then in general n-faces. These elements are summed up nicely here. Firstly we take a field of say $latex \mathbb{R}^n$. Next we construct the vertices of the n-cube. Basically we are taking all the n dimensional vectors which have all the combinations of 0's and 1's for each entry of the vector. More mathematically, There is a vertex described by each vector $latex \begin{pmatrix}a_1\ a_2\ \vdots\ a_n\end{pmatrix}$ where $latex a_i \in {0, 1}.$ There is an edge between vertices $latex \begin{pmatrix}a_1\ a_2\ \vdots\ a_n\end{pmatrix}$ and $latex \begin{pmatrix}b_1\ b_2\ \vdots\ b_n\end{pmatrix}$ if and only if $latex a_j \ne b_j$ for exactly one $latex j \in {1, \dots, n}$. $latex \qquad \qquad \vdots&s=4$ There is an m-face between (or though) vertices $latex \begin{pmatrix}a_1\ a_2\ \vdots\ a_n\end{pmatrix}$ and $latex \begin{pmatrix}b_1\ b_2\ \vdots\ b_n\end{pmatrix}$ and ... and $latex \begin{pmatrix}m_1\ m_2\ \vdots\ m_n\end{pmatrix}$ if and only if $latex a_j \ne b_j \ne \dots \ne m_j$ for exactly $latex (m - 1), \;\; j \in {1, \dots, n}$.
Basically this means we list the vertices just as if were were counting in base 2. And then we can group these vertices into different groups based on the n-face level and (if we think of the vertices of a bit string) how many bits we have to change to make two vertices bit streams the same. This approach is very interesting because the concept of grouping these vertices relates strongly to hypergraphs.
Another way to think about it is as follows. Edges, from the set of all edges (i.e. joining each vertex with every other vertex), are the ones that are perpendicular to one of the standard basis vectors. This generalises to n-faces; from the set of all n-faces (i.e. all ways of grouping vertices into groups of n) are those that the object constructed is parallel to the span of any set of n of the standard basis vectors.
When you think about it, a lot of things that you can say about the square or cube generalise. For instance you can think of a square being surrounded by 4 lines, and cube by 6 surfaces, a tesseract by 8 cells, etc.
Visualisation Methods
Now that we have some idea how to describe and build n-cubes, the next question is how do we draw them. There are numerous methods and I can't explain them all in this post (such as slicing and stereographic projection, as well as other forms of projection (I'll leave these for another blog article)). But another question is also what aspects do we draw and how do we highlight them. For instance it may seem trivial in two dimensions to ask do I place a dot at each vertex and use just 4 solid lines for the edges. But in higher dimensions we have to think about how do we show the different cells and n-faces.
Firstly, how can we draw or project these n dimensional objects in a lower dimensional world (ultimately we want to see them in 2D or 3D as this is the only space we can draw in). This first method is basically the exact same approach that most people would have first learnt back in primary school. Although, I do not think it makes the most sense or makes visualisation easiest. Basically this method is just the take a dot and perform a series of stretches on it that I described earlier, although most people wouldn't think this is what they were doing. Nor would we usually start with a dot, we would normally start with the square. Although we will, so we start with this.
[caption id="attachment_79" align="aligncenter" width="15" caption="0-cube."]![]() [/caption]
[/caption]
We would now draw a line along some axis from that dot, and place another dot at the end of this line.
[caption id="attachment_74" align="aligncenter" width="112" caption="1-cube, showing vertices and edges."]![]() [/caption]
[/caption]
Now from each of the dots we have, we would draw another line along some other axis and again draw a dot at the end of each of those two lines. We would then connect the newly formed dots.
[caption id="attachment_75" align="aligncenter" width="120" caption="2-cube, showing vertices and edges."]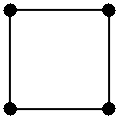 [/caption]
Now, we just keep repeating this process where by each time we are drawing another dimension. So we take each of these four dots and draw lines from them in the direction of another axis, placing a dot at the end of each of these lines, and joining each of the dots that came from other dots that were adjacent, with a line.
[caption id="attachment_91" align="aligncenter" width="180" caption="3-cube, showing vertices and edges."]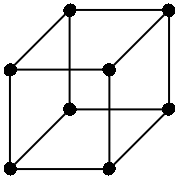 [/caption]
Now for 4D and beyond we basically keep the process going, just choosing really anywhere from the new axis, so long as it passes though the origin.
[caption id="attachment_78" align="aligncenter" width="240" caption="4-cube, showing vertices and edges."]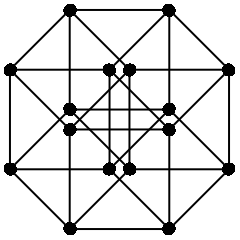 [/caption]
If we do a little bit of work we can see that this map is given by the matrix,
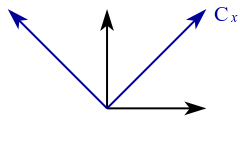
$latex \begin{pmatrix}1&0&r_1\cos \theta&-r_2\cos\phi\\ 0&1&r_1\sin\theta&r_2\sin\phi \\ 0&0&0&0 \\ 0&0&0&0 \end{pmatrix}$
where $latex \theta$ is the angle of the projected z axis from the x axis, and $latex \phi$ is the angle of the projected w axis from the negative x axis. Also r1 and r2 are the scales of the third and fourth respective receding axis (it makes it "look" more realistic when we use a number less than 1) This is just an extension of oblique projection for 3D to 2D.
Now this method seems very primitive, and a much better approach is to use all the dimensions we have. We live in a three dimensional world, so why just constrict our drawings to two dimensions! Basically, an alternate approach to draw an n-cube in three dimensional space would be to draw n lines all passing though a single point. Although it is not necessary to make all these lines as spread out as possible, we will try to. (This actually presents another interesting idea of how do we equally distribute n points on a sphere. For instance we can try to make it so that all the angles between any two of the points and the origin are equal. But I will leave this for another blog article later.) We then treat each of these lines as one dimension from there we can easily draw, or at least represent an n-dimensional point in 3D space. Now obviously we can have two different points in 4D that map to the same 3D point, but that is always going to happen no matter what map we use. The following set of 4 vectors are the projected axis we will use as a basis.
$latex \left \{ \mathbf{e_1}, \mathbf{e_2}, \mathbf{e_3}, \mathbf{e_4} \right \} = \left \{ \begin{pmatrix}1\\1\\1 \end{pmatrix}, \begin{pmatrix}-1\\-1\\1 \end{pmatrix}, \begin{pmatrix}-1\\1\\-1 \end{pmatrix}, \begin{pmatrix}1\\-1\\-1 \end{pmatrix} \right \}$
Now I won't say how I got these (actually I took them from Wikipedia, they are just the vertices of a 3-simplex) but all of the vectors share a common angle between any two and the origin.
Now if we draw in our tesseract, highlighting the cells with different colours (not this became problematic with some faces and edges as they are a common boundary for two different faces, so you cannot really make them one colour or the other) we get something like this,
[caption id="attachment_93" align="aligncenter" width="450" caption="Tesseract projected onto R3. The cells are shown in different colours, the purple lines show the four axis."]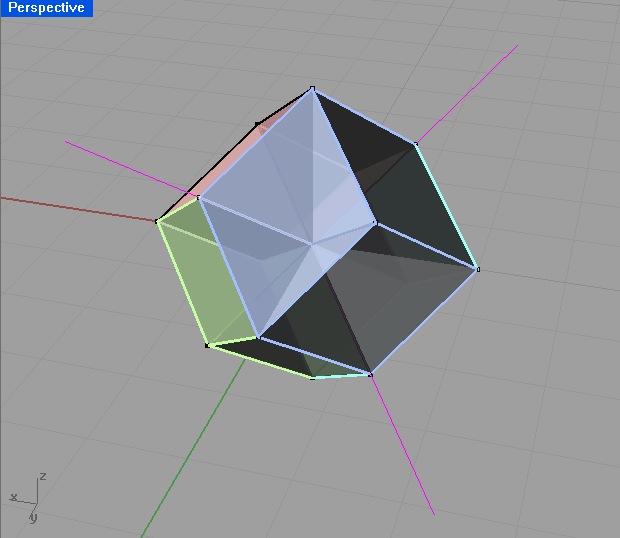 [/caption]
The projection matrix for this projection is then simply (from the vectors that each of the standard basis maps to),
$latex \begin{pmatrix}1&-1&-1&1\\ 1&-1&1&-1\\ 1&1&-1&-1 \end{pmatrix}$
Now if we compare this to our original drawing (note I'm not talking about the projection used, but rather the presentation of the drawings, i.e. the colour.) I think you will see that the second one is clearer and try's to show where the cells and faces are, not just the vertices and edges. Note also the second one is in 3D so you can rotate around it. Looking at the first one though, you will notice it doesn't show where the faces or cells are. Remember that we have more than just vertices, edges and faces. We have cells, and n-faces. These are essentially just different groupings of the vertices. But how can we show these. Now the most mathematical way would be to just list all the different groupings. This is okay, but I like to see things in a visual sense. So another way would just show different elements. Like you draw all the vertices on one overhead, edges on another, and so on. Then when you put all these overheads on top of each other we get the full image, but we can also look at just one at a time to see things more clearly. This would be particularly more useful for the higher dimensional objects and higher dimensional elements. We can also use different colours to show the different elements. For example in the square, we can see that the line around surrounding it is 4 lines, but in higher dimensions its not so easy, so we can colour the different parts to the element differently. (When I say part I mean the 4 edges of a square are 4 different parts. Whereas the edges are all one element, but are a different element to the vertices.)
Some Interesting Properties
Once you start defining hypercubes there are many interesting properties that we can investigate. For this section lets just assume that we have the standard hypercube of side length 1. Now we can trivially see that the area, volume, etc. for the respective hypercube will always be 1. As described above each time we add another dimension and sweep the object out into that dimension we effectively multiply this hypervolume by 1. So for an n-cube, the hypervolume of it will be $latex 1^n$. When I say hypervolume I mean the one that makes sense for that dimension. E.g. in 2D, area, in 3D, volume, and so on.
The next obvious question to ask is what is the perimeter, surface area, cell volume, ..., n-face hypervolume of the respective n-cube? It gets a little confusing as you have to think about what exactly you are finding. Is it a length, an area, a volume? Well it will just be an (n - 1) volume. Eg. in 2D we are finding a length (the perimeter), in 3D, an area (surface area), and so on so that each time we increase the dimension of the n-cube we increase the units we are measuring in. Well if we just start listing the sequence (starting with a square), 4, 6... we notice this is just the number of (n - 1) degree elements. Namely, the number of edge, faces, cells, etc.
This leads me in the obvious question of how can I calculate the number of m-elements of the n-cube?
Well instead of me just going to the formula, which you can find on Wikipedia anyway, I will go though my lines of thinking when I first tried to work this out. Number of vertices is easy, each component of the n-vector can be either a 0 or a 1. So for each component there is 2 possibilities, but we have n of them, so it is just 2x2x2... n times, or 2n. Now originally when I tried to work out the number of edges, I started listing them and saw that I could construct the recurrence... Although with the help of graph theory it is very simple. In graph theory the handshaking theorem says $latex \displaystyle 2\left |E \right| = \sum_{v \in V} \mbox{deg}(v).$ Where $latex \left | E \right |$ means the number of edges, and $latex \mbox{deg}(V)$ means the degree of vertex V, which means the number of edges connected two it. Now if we think of an edge being a group of two vertices where you only make one entry of the vector change to get from one vector to the other, then we can see that there are exactly n way of doing this. We can either change the 1st entry of the vector, or the 2nd, or the ...., or the nth. Thus each vertex has of the n-cube graph will have degree n. So as we have 2n vertices and each vertex has degree n, then the sum of the vertex degrees will be n2n. Hence by the handshaking theorem, $latex |E| = \frac{1}{2} n 2^n = n 2^{n-1}.$ I am not exactly sure how to generalise this further. I will leave it for another article. However, the formula is $latex 2^{n-m} \binom{n}{m}.$
(I shall try to write more at a later date.)
References:
- Hypercube. (2008, October 14). In Wikipedia, The Free Encyclopedia. Retrieved 08:19, October 21, 2008, from http://en.wikipedia.org/w/index.php?title=Hypercube&oldid=245242295
- Tran, T., & Britz, T. (2008). MATH1081 Discreet Matematics: 5 Graph Theory.
