avatar tianjara.net | blog icon Andrew Harvey's Blog

Entries from February 2011.

Reading and Writing ESRI World Files
20th February 2011

As part of my quest to georeference the old NSW Parish Maps, I ran into the ESRI World file format...

The Format

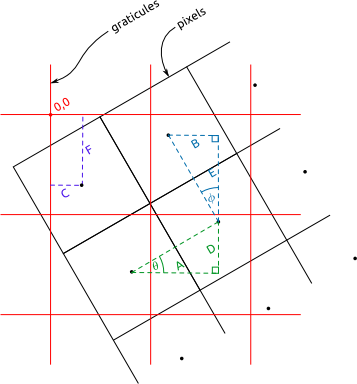
I relied on lot on http://en.wikipedia.org/wiki/World_file as a reference when figuring out how to make sense of world files. I remade the diagram from http://en.wikipedia.org/wiki/File:WorldFileParametersSchemas.gif, into two views: pixel centric, and graticule centric (svg versions here).

World File Pixel Centric DiagramWorld File Graticule Centric Diagram

...and a difference case, where the graticules are rotated in the other direction,

World File Pixel Centric - With Left Rotation

For the purposes of my java program (which I explain below), I define theta as the angle the east/west pointing graticules (I call them lat graticules as they are shown at regular lines of latitude) make with the horizontal, and phi as the angle the north/south pointing graticules (I call them long graticules as they are shown at regular lines of longitude) make with the vertical.

Keep in mind that the image coordinate system and projected coordinate system are different (assuming we are using some kind of UTM projection).

Writing to a Wld File

Some of the parish maps have graticules shown and a reference origin for the easting and northing values on the graticules. If we can extract this information we should be able to georeference the raster maps. Actually I'm not sure what projection is used... but I think using a zone of universal transverse mercator should be okay. Also I assume that the eastings and northings on the map are in chains.

The first step is extracting the graticules from the raster map to vectors. I do this by loading the image into Inkscape and tracing the graticules as line segments, with an svg path id for the segment something like "w220", for example to indicate west 220. After I have this svg file I run it through pmap-svggraticules2csv.pl which extracts these vector graticules from the svg file and saves them into a csv file.

[caption id="attachment_1275" align="aligncenter" width="421" caption="Example of vector graticles drawn over the raster map. Base map is Public Domain."]Example of vector graticles drawn over the raster map. Base map is Public Domain.[/caption]
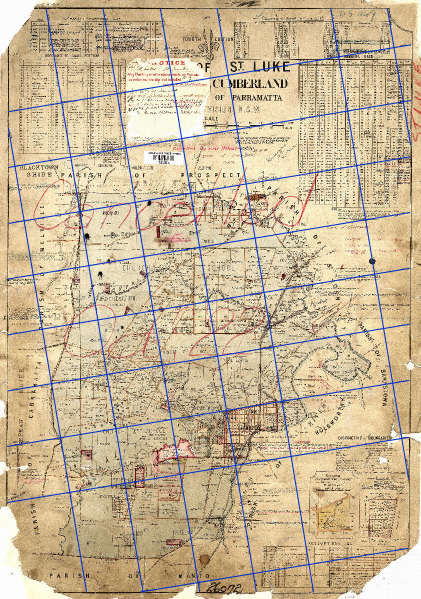
From the csv file I then can use my Java program graticules2wld to find a best fit world file (which is really just an affine transformation matrix) to georeference this raster image via a best fit approach.

An alternative is to use pmapgrid2gcps.pl to extract ground control points (GCPs) from the svg file by finding the intersection points of the graticules. You can then pass these gcps to GDAL, to either warp the image or use gcps2wld.py (from the Debian package python-gdal) to make a best fit world file from the gcps.

I've made a debian package for the graticules2wld program. The package was really hard to make, although in the end I finally did get it working. I ended up using jh_makepkg on just the source (i.e. using no external buildfiles, just the source code). If you want to make the debian package yourself you should be able to grab this directory, then under graticules2wld-0.1 run dpkg-buildpackage. If you are able to help me so that I'm not duplicating my code in this deb-source directory in the source tree, please help me.

The Next Step...

Half the point of using the world file, is so I can load the original image into JOSM and apply the affine transformation matrix (from the world file) to show the raster as a backdrop without having to warp the image unnecessarily. So my next step is to get JOSM to be able to open raster images with a world file and correctly place it as a backdrop in the editor window.
Tags: dev, geo.
Multi-dimensional Data Cubes for Census Data
20th February 2011

The main thing I got from a short talk by Samuel Spencer at the 2011 apps4nsw day was a new way to publish ABS census data. Below is an example showing storing census data as multidimensional data cubes. The idea is that this allows data consumers to construct their own arbitrary queries. Using the example shown, if you want the total population, just sum up all the data cubes. If you want the ratio of males to females just sum up all the data cubes for gender=male, and then gender=female (i.e. you take a slice of the hypercube). (svg source for this diagram)


Example showing storing census data as multidimensional data cubes.

This allows data providers to push out one large data set (or it could also be implemented as an API) and allow the data users to extract the information they want, rather than the data provider providing a bunch of common slices of the single large multi-dimensional data cubes.

Tags: abs.
Using XSLT to Transform XML data into OSM format
14th February 2011

For a while I used to think that all there was to XML was <blah attribute="value">inner</blah>, but of course there is much more. I'm now digging into the real stuff like XPath, XSLT and XML Schemas.

I've come across a data set of bus stops (as well as live info on where buses are, and their status). The bus stop data set (http://nswbusdata.info/ptipslivedata/getptipslivedata?filename=stopdescriptions.zip, no longer active so I'm hosting my original copies at http://tianjara.net/data/nsw-buses/ for preservation) is in an XML format,

<?xml version="1.0" encoding="UTF-8" standalone="yes"?>
<StopDescriptionList license="http://creativecommons.org/licenses/by-nc-nd/3.0/au/" copyright="NSW Roads and Traffic Authority">
    <stop longitude="151.17832" latitude="-33.81852" tsndescription="Osborne Rd nr Ronald Av" TSN="206699"/>
    <stop longitude="151.17359" latitude="-33.8082" tsndescription="Ralston St nr Murray St" TSN="2066138"/>
    <stop longitude="151.17764" latitude="-33.82054" tsndescription="Second Av nr Osborne Rd" TSN="206698"/>
    <stop longitude="151.17629" latitude="-33.81926" tsndescription="Fourth Av nr Second Av" TSN="206697"/>
  ...

Although because of the license, I cannot use this data in OpenStreetMap, I was still interested in converting it into an a .osm file. The perfect job for XSLT!

It turned out to be quite a simple task with a neat solution. My XSLT stylesheet used to do the translation:

<?xml version="1.0" encoding="UTF-8"?>
<xsl:stylesheet xmlns:xsl="http://www.w3.org/1999/XSL/Transform" version="1.0">
    <xsl:output method="xml" indent="yes"/> 

    <xsl:template match="/StopDescriptionList">
        <osm version='0.6' generator='XSLT'>
            <xsl:apply-templates select="stop"/>
        </osm>
    </xsl:template>

    <xsl:template match="stop">
        <xsl:variable name="count">
            <xsl:number/>
        </xsl:variable>

        <node id='-{$count}' lat="{@latitude}" lon="{@longitude}">
            <tag k='ref:tsn' v='{@TSN}' />
            <tag k='fixme' v='{@tsndescription}' />
        </node>
    </xsl:template>

</xsl:stylesheet>

Then it was a just a simple,

xsltproc -o busses.osm busses-stylesheet.xslt stopdescription.xml

The data is CC BY-NC-ND 3.0, but they sneak in some additional terms in the fine print, which in addition to the NC-ND would further lead to incompatibilities with the OSM license, and would under my definition of free data, make this data set non-free. For interest the first three additional terms are,

  1. You must not use the Data in any way that could create false or misleading outcomes or interpretations, or bring the RTA into ridicule or disrepute. You must not use the Data in conjunction with the promotion of alcohol or unsafe road practices.
  2. You must ensure that the Data used is current, and provide details as to the date and time of sourcing the Data from the RTA in all reproductions of the Data (including in any software applications incorporating the Data).
  3. In all reproductions of the Data (including in any software applications incorporating the Data), the following disclaimer must be provided: “The accuracy or suitability of the Data is not verified and it is provided on an “as is” basis.”
Tags: dev, osm.
MySchool 2.0... I'm ready for another scraping challenge.
12th February 2011

A quote from Parliament, (gov source) (sorry, not up on OpenAustralia yet):

Ms SMYTH (La Trobe) (3:15 PM) —My question is to the Minister for School Education, Early Childhood and Youth. How will the My School website deliver greater transparency and information to parents? Mr GARRETT (Kingsford Smith) (Minister for School Education, Early Childhood and Youth) —I thank the member for her question. The fact is that My School has transformed community understanding of school performance, providing the community and parents with information about important areas of schooling, including literacy and numeracy—information that was never before available other than for education bureaucrats and officials. With some 4.6 million visits to the My School site since its launch, it is clearly a matter of great interest to all Australians. Now My School 2.0 will take transparency to a new level, with significant new features. Importantly, financial data on each school will be reported for the first time to everyone to provide a clear picture of the resources that are provided to schools to support the education of students. The collection of this financial data is a complex task and to ensure that it is robust information and comparable, the Australian Curriculum Assessment and Reporting Authority—ACARA—commissioned a detailed validation process undertaken by leading accounting firm, Deloitte. Later in November Deloitte identified an anomaly in the information collected, which could lead to a misstatement of recurrent income for independent schools. Deloitte recommended to ACARA that further validation and consultation take place. On 2 December I announced that My School 2.0 would only be launched after this further validation, and consultation with independent schools, had been undertaken. I also wrote to the ACARA chair requesting a detailed timetable on how outstanding school data issues would be resolved. I can inform the House that over summer ACARA has liaised extensively with individual schools and consulted with the Independent Schools Council and relevant state and territory associations of independent schools because I wanted to make sure that impacted schools had been contacted by ACARA and that they had had time to check their data and understand how the data will be used and reported. I can advise that every independent school in the country has been contacted by ACARA by email. Follow-up contact by telephone has been made when requested and as required and over 900 independent schools now have school finance data reports that have been quality assured by ACARA, Deloitte and my department. These schools are now being given the opportunity to review what their My School finance page will look like because My School 2.0 will also include an enhanced ICSEA—Index of Community Socio-Educational Advantage—where the methodology has been improved to provide a more accurate direct measure based on parent education and occupation. It is a case of making good data even better. The change to ICSEA methodology has led to some changes in ICSEA values and less than four per cent of all schools did request a review of their ICSEA value. These schools were given the opportunity to provide more relevant data or information on changed school context. Now schools and systems have had nearly three months to provide the additional data in support of their review request. Information has been considered by the ICSEA expert panel to be satisfied that each school’s value is robust based on the most accurate data available. So today, I am pleased to advise that the further work I asked ACARA to do in relation to school data has almost been completed and that My School 2.0 will be ready for release on 4 March. With My School 2.0 ready for release on 4 March the government will deliver an important and fundamental reform—one acknowledged by the Leader of the Opposition as worthy of the name ‘reform’. Importantly, it is a reform that empowers parents to influence the quality of their child’s schooling and empowers education ministers, for the first time, with a national dataset to target school improvement. Importantly, it is a reform that underpins this government’s substantial reforms in the area of education. We want to provide every school in Australia with the possibilities of a great education.

So, come March 4, I look forward to writing another scraper to get this data in a usable exchange format, and out of the unusable HTML mess.

p.s. data dumps and scraping code for the existing site are currently up at https://github.com/andrewharvey/myschool.

No tags

RSS Feed