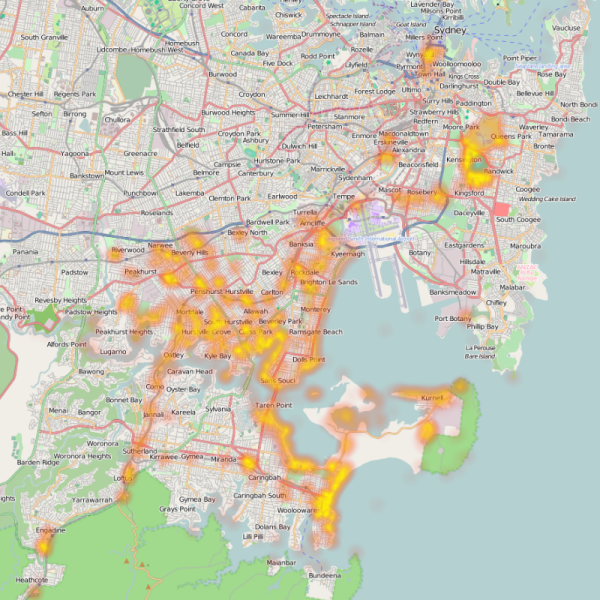
In the past few months I've been contributing to the OpenStreetMap database. From the day I started I've had privacy concerns on my mind. If a criminal goes around committing crimes, leaving behind a signature and always travelling x km from home to commit the crime, you get a nice circle around their home. So I'm interested to see what kind of pattern I'm leaving behind. Someone else has probably got an existing solution out there, but I decided to experiment and put together something myself.
I already had all my osmChange files (i.e. the ones from http://www.openstreetmap.org/api/0.6/changeset/${changeset_id}/download). I pull these daily from http://api.openstreetmap.org/api/0.6/changesets?display_name=aharvey find the changeset ids and download the osmChange files for all my new changesets. I do this as I try to keep a local copy of things I upload into the cloud, as a backup in case the service I uploaded to ever decides to cut my access. I know I should really be saving a copy of what I upload, rather than uploading then asking the cloud server for a copy, but JOSM uploads a full osm file, not an osmChange file. Scripts here.
Anyway, from these osmChange files I pull out the coordinates of all the nodes I created or modified, script here.
From this list of points I could use any heat map program. gheat which is based on http://blog.corunet.com/the-definitive-heatmap/ looks good. The problem is I ran out of time setting it up– it wasn't in the Debian repository. Instead I used http://www.sethoscope.net/heatmap/, which I combined with a wrapper script to render to tiles in the OSM Slippy Map format. However it is really slow– perhaps I should try to speed it up.
Now that I had the transparent heat map tiles, the next step was to get these on top of an OpenStreetMap map. Given they are in the standard format, it should be really easy to add this layer to any software that lets you view OSM tiles. Support for overlays like this in libchamplain is on my todo list, in the meantime I gave Polymaps a try, HTML with JavaScript embedded here.
[caption id="attachment_1246" align="aligncenter" width="600" caption="Heat map image of my created or modified nodes in OpenStreetMap"] [/caption]
The results don't come as much of a surprise, I already knew which areas I edit and how much. This map is also biased towards nodes, and doesn't take into account editing an existing way or relation. One surprise was some cosmetic work along creeks shows up as nice lines (tracing a creek adds a lot more nodes than adding a single toilet node)...
Postscript
While I was working on this I once again needed a bbox string to test with. This has come up a lot in the past and I didn't know any easily way to use a GUI to position the map, and then just copy and paste the bounding box of that view. So I made a modification to one of the libchamplain demos to return a bounding box from the current view.