avatar tianjara.net | blog icon Andrew Harvey's Blog

Entries tagged "geo".

A better map for NSW RFS Current/Major Incidents/Bushfire Feed
5th November 2013

A few weeks ago surrounding Sydney was facing some serious bushfires. Like a lot of other people, I wanted information. Information on where the fires where and when they were there so I could plan which areas to best avoid.

RFS Incident Map

The RFS do have a map on their website to show this, but I was frustrated by their tiny map and its poor usability.

Clicking each marker gave you a popup which filled the whole map window making it very hard to close again and pan around.

So I set off and quickly hacked together the basics to take the data their map and place it on a full screen Leaflet map.

Currently map.rfs.nsw.gov.au goes nowhere, so I built the website I expected to get by going to map.rfs.nsw.gov.au and I now host it at http://tianjara.net/rfs

There was some initial pain with consuming their GeoRSS feed but I managed to resolve that. I'm also quite pleased with the nicely formatted popups. They are highly visual and easy to read (eg. "2 hours ago" rather than a full date time string).

I've released the whole site under the CC0 license. http://github.com/andrewharvey/map.rfs

I've also sent off a note to the RFS explaining my motives and what is wrong with their map and that hey here is an example of how to make it better. Unfortunately I've hear nothing back from them.

Tags: geo.
The light is near: Fun with vector tiles
20th November 2012

Small side projects come an go yet I always seem to come back to the task of trying to showcase ABS census data geographically.

In the backend I have built a soild foundation for providing the base geography. That part is quite stable now. The backend for providing the census data is in pretty good shape now, just some polishing of the edges to do.

The real milestone I've hit now is getting those census regions on a slippy map as vector tiles (tick on those ASGS 2011 overlays, only some regions/zoom levels/layer combos available at the moment though).

I've done this using the excellent TileLayer.GeoJSON provider for Leaflet in combination with the TileStache PostgreSQL vector provider with the vector-simplify patch for TileStache to perform zoom dependent geometry simplification.

I think this will result in a really neat design as you can apply endless thematics to these geometries client side, you just need to pull in the census data as a simple JSON and join it to the geometries. Plus you get all the benefits of vector tiles such as hover effects and clickability.

Tags: geo.
Cartograhpic Principles
25th October 2012

I've recently read an article which has given me a huge insight into some cartographic principles. Principles which I had been using were given the rigour they deserved.

What I gain most from it was that one kind of map among many is the physical map. The physical map is designed to portray the feeling of the environment. One way to do this is to use a suitable base landcover palatte as suggested in the article, combined with relief shading and textures to represent the environment to the fullest extent.

The use of hypsometric tints is debated. Personally I think that every map feature is fit for a purpose and hypsometric tint are no different. It is deciding what you want your map to show, and how you are going to combine these features into a single map to make it multi-purpose.

Hypsometric tints are useful for showing elevation levels (no surprise there). So for showing points above a certain altitude where the air may be getting thinner, or comparing which of these two mountains is higher, or by gauging if this is just a small hill or Mount Everest.

Contours are good for showing steepness (how close the lines are together) and identifying the gradient of a paths by if the path runs parallel or orthogonal to the contour line.

Shaded relief is great for getting a general sense of where the hills are and their form.

Physical coloured landcover combined with textures or representative bump maps give you a feel for the environment.

The next task is building up a physical map which gets applied to OSM data (possible in tandum with other free sources) which uses natural colours, shaded relief, textures and bump maps. The only question is whether to build something like the Stamen watercolour maps but with natural colours and textures, or instead work towards a natural style for osm2world (or any other osm to 3D world program).

Tags: geo.
A free and open source SRTM shaded relief and contour map
9th October 2012

I've recently pushed out a new srtm3-stylesheets repository which contains shell scripts for working with NASA SRTM DEM data, gdaldem based stylesheets for shaded relief maps, Mapnik stylesheets for contours and a TileStache configuration for sandwich those styles together into a single map.

This was spurred on by the fact that I simply needed a map which showed hills. I've used Andy Allan's OpenCycleMap in the past which has color relief and contours. Unfortunately it is closed source.

So I put my head down and hacked together repeatable scripts to get the source data up and running and some basic stylesheets to produce a usable and pleasant looking map. All released as free and open source software under the CC0 license.

Contour Map

I want to avoid adding things like streets etc, such maps could be built as separated layers based upon this style and sandwiched together, for example, with the TileStache sandwich provider.

I hope to build upon the lessons learnt here to produce a map like the Stamen Terrain map, except with the source code released under a free and open source license. Perhaps just with hill and slope shading applied to landuse with other map features placed on top.

Contour Map

Contour Map

I've rendered NSW (only server resource prevent worldwide!) as a slippy map here.

Tags: dev, geo, osm.
Making a Shaded Relief Map from the Geoscience Australia Australian Bathymetry and Topography Grid
30th September 2012

I've just released some scripts and stylesheets for the Geoscience Australia Australian Bathymetry and Topography Grid data.

Here are some samples of the final outputs. (also available as a layer on my demo slippy map)

ga-ausbath-shaded-relief-extent


ga-ausbath-shaded-relief-gbr

ga-ausbath-shaded-relief-tas-landmass

ga-ausbath-shaded-relief-islands

These images based on data © Commonwealth of Australia (Geoscience Australia) 2009, which was released under the Creative Commons Attribution 2.5 Australia Licence, http://creativecommons.org/licenses/by/2.5/au/.

The code I used to produce these images is CC0, so as far as I am concerned you are free to recreate them under whichever license is compatible with the upstream data. If you just wish to use these images, I license the ones you see here (so only if you grab them from here, rather than re-rendering them) under the Creative Commons Attribution 3.0 Australia license, http://creativecommons.org/licenses/by/3.0/au/.


Tags: dev, geo.
Loading the ASGS into PostgreSQL in preparation for the ABS 2011 census data release
15th April 2012

Over the extended Easter period I found myself with some extra free time, the result is https://github.com/andrewharvey/asgs2pgsql - A bunch of scripts for loading the ASGS into PostgreSQL/PostGIS, and a database dump of the final product.

The ASGS is the geospatial fabric for the ABS 2011 Census data. My idea was to put in place a stable PostgreSQL schema for the ASGS and put together a well defined process for loading data into that schema.

As a small example of using the data I wrote some carto/qgis stylesheets for the various ASGS structures. Source code is at https://github.com/andrewharvey/asgs-stylesheets with a live example at https://tianjara.net/leaflet.html#map=asgs-2011-mb which shows the ASGS Mesh Blocks coloured by the landuse assigned to that mesh block.

With this building block now in place, when the actual census data starts to be released in June 2012 I will hopefully be able to load it into a relational data model with references to ASGS geometries all in PostgreSQL (and PostGIS).

I'm not sure if I'll need to choose between wasting time scraping data from the ABS website or I should go straight to the DVD

If the $100 is really just for the cost of the DVD+admin surely the ABS can put the entire DVD contents on its webserver, all under the Creative Commons Attribution license. If I do purchase the DVD I sure as hell would want to ensure it notes that its contents are CC-BY licensed.

I also am interested if the census data will also be available as datacubes.

Tags: abs, geo.
Development Update (Static OSM Tiles, git rebase, Map Labelling)
11th December 2011

Map Labelling Suburbs and Cities

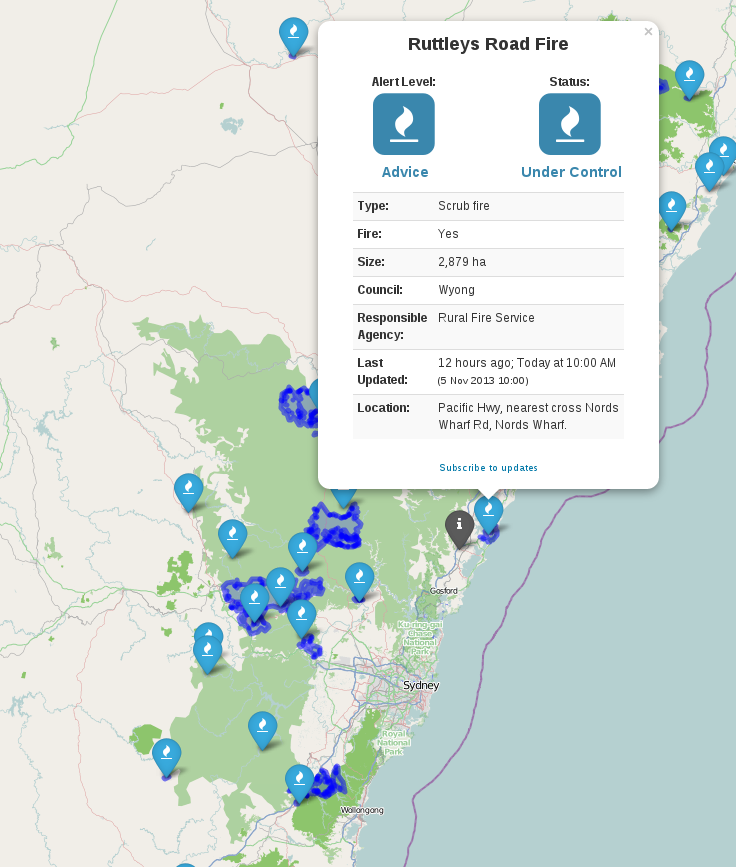
Yesterday I pushed a bunch of changes to my OSM/Aerial Imagery Hybrid Style, see the (demo). I spent a bit of time on suburb and city labels as they are a really important feature of a map aimed at non-experts.

I'm finding making a non-trivial style like this has defiantly made me realise the difficulties of such a task.

There are a lot of improvements that can be made (either by modifying or making new components) to the OSM Mapping conventions, osm2pgsql/imposm, mapnik library, carto language stack. That said, the current form is still great and you can still make great maps. But,

I would like to be able to but this needs
have labels for large bays at lower zooms than small bays need bays mapped as closed ways covering their area, rather than a point in the centre
define a linear function for the size of icons. i.e. at z10 the icon is 10px, at z20 the icon is 20px, now linearly interpolate all sizes for zooms in between either build this functionality into the carto language, or make another higher level macro like language which you can code this in which is then compiled into carto
render spread text inside a riverbank needs functionality in the mapnik rendering engine

Static OSM Tiles

I'm still yet to find a tile server which is fast and works well with lighttpd (nginx would probably suffice too). As an experiment I decided to pre-render a bunch of tiles for my hybrid style sheet. This tile layer doesn't need to be minutely updated, anyone who needs that can use the normal mapnik layer. Also static tiles server straight from the webserver should be pretty fast (maybe on memcached tiles would be faster) and I wanted my tiles to be fast.

Next up how can I generate these static tiles? There is the popular generate_tiles.py, but that won't render meta tiles, seems like such a waste to render every tile with a buffer of 128px when I would render a 5 by 5 meta tile of the same buffer for only 36% of the total pixels rendered. The larger the meta tiles the larger the latency, but if I'm pre-rendering them all than latency doesn't matter any more.

So I wrote a C++ program as my replacement for generate_tiles.py. I also programmed it to render from a list of meta tiles rather than a bbox. This means for my demo I can only render high zooms where there is nearmap coverage. This is where https://github.com/andrewharvey/OSMTileListFromGeometry/ came in, which pulls nearmap coverage areas from an osm2pgsql database, and generates a list of meta tiles.

Using this method I rendered up to and including zoom 17, composed of 22444 5 by 5 meta tiles or 561100 regular tiles in a time of,

real    198m17.021s
user    103m49.985s
sys     37m36.117s

with disk usage,

<1M   0-8
2.0M  9
6.8M  10
26M   11
98M   12
13M   13
36M   14
114M  15
411M  16
1.5G  17
========
2.2G  total

(Updated with results when using "png" rather than "png256")

real    228m17.082s
user    160m24.725s
sys     31m42.653s

with disk usage,

<1M   0-8
3.1M  9
8.6M  10
28M   11
121M  12
34M   13
83M   14
218M  15
663M  16
2.0G  17
========
3.1G total

I think that time could still be sped up with,

Git Rebase

As I use git more and more I'm slowing learning more of the features it has to offer (and thanks to the free hosting by github). One such feature which I think is awesome is git rebase. As an example the other day I did git commit -ammend instead of git commit --amend (I knew there was a duplicate character somewhere but because I seem to have a tint of dyslexia I confused the duplicate -- with mm).

Of course this resulted in committing all files which had changed with a message of "mend" as a new commit. I did this twice, and only noticed after I had already made a bunch of correct commits afterwards. With git rebase I could pop some commits of the commit stack, remove the two "mend" commits fix the commit which I should have been amended to and pop my other commits back on top of the stack.

Thanks to http://stackoverflow.com/a/180085.

Next Up

Tags: dev, geo, osm.
OSMT
9th October 2011

I feel the map style I've been working on recently is in good enough shape to announce. It is written in carto and designed to be used with OpenStreetMap data. It is an overlay layer for aerial imagery, though in my example I use NearMap imagery.

Take a look at http://tianjara.net/osmt.html.

The source is at https://github.com/andrewharvey/osm-hybrid-carto/, licensed CC-BY-SA.

There is still lots of work to do on it though.

I also have a lightweight cycle-overlay too (view example at http://tianjara.net/leaflet.html and tick on the cycle overlay or view the code at https://gist.github.com/1216315)

Tags: geo, osm.
3D NearMap Prototype From 4 Oblique + 1 Ortho
4th September 2011

I was on a flight the other day and I enjoyed looking down and seeing the land from a different perspective. It reminded me of a project I was working on which was essentially a 3D map viewer like Google Earth, but not in perspective and just implemented in the web browser. The main incentive was NearMap doesn't just offer orthophotos, but 4 oblique views too. So leveraging on Polymaps I got a prototype working: http://tianjara.net/3d-nearmap.html It allows you to move the camera with the WASD keys, when your view angle gets smaller (less straight overhead) it switches to the oblique views. (It would be nicer if you could use the mouse to rotate though... patches welcome)

Just viewing the obliques with NearMap's front end at nearmap.com, you will often find all the buildings are slanted on an angle, with my viewer however you can correct this to make them straight and looking nice again by tweaking the camera rotation. If nothing else came out of this experiment I think that just the mere ability to easily correct this artefact to produce nicer looking obliques made it a worthwhile endeavour.

You could push the concept further and add perspective (like Google Earth, rather than my simple parallel projection) and have each tile pick the optimal {Vert|N|S|E|W} layer, although with LIDAR progressing we can now capture true 3D so we don't need to fake it with 2D images any more...

Tags: geo, nearmap.
Using TileMill to make OpenStreetMap Map Stylesheets
6th June 2011

A short time ago TileMill got support for PostGIS data sources. I'm really excited by this as it means you can use TileMill, which is very easy to use, having a gentle learning curve, to construct your own OpenStreetMap stylesheets and see the data being rendered using your style. This is great! e.g. in less than an hour I made this,

[caption id="attachment_1306" align="aligncenter" width="600" caption="Map data © OpenStreetMap contributors, CC-BY-SA"]Map of Sydney made using TileMill from OSM Data.[/caption]

Want a map which just shows the drainage network (which you can see from low zooms)? Easy.

[caption id="attachment_1307" align="aligncenter" width="600" caption="Map data © OpenStreetMap contributors, CC-BY-SA"]Sydney Drainage Map[/caption]

I'm sure I'll be publishing lots of new styles in the near future, one of which will be a style designed as an aerial image (NearMap) overlay. Exciting times ahead...

Tags: geo, osm.
Using ABS ASGS Data in OpenStreetMap
17th March 2011

A little while ago Marcus Blake from the Australian Bureau of Statistics asked the OSM community about the potential use of some ABS data. As I mentioned on the list I think it is good that at least some government departments are making their data available under free licenses and that they engage with with the community to sort out any technical details about the data.

As described by the ABS, the ASGS is essentially data describing geographical areas.

[caption id="attachment_1290" align="aligncenter" width="580" caption="ASGS ABS Structures - CC-BY 2.5 AU Australian Bureau of Statistics"][/caption]

[caption id="attachment_1291" align="aligncenter" width="600" caption="ASGS Non-ABS Structures - CC-BY 2.5 AU Australian Bureau of Statistics"][/caption]

Working out which if any structures should be incorporated into OSM and how needs careful consideration, and I've posted some of my thoughts to the list. In the mean time, since the data does contain some landuse information I've been looking into how best to use this information to aid in mapping. A blind import is not an option in my opinion, but I thought it would be handy to see the data as a base map when mapping.

I did try using ogr2osm to convert the data to the OSM xml format to load into JOSM (I even got the translateAttributes function for ogr2osm working for this dataset), but due to the nature of the data, I think a simple raster underlay works well. I tried two approaches in parallel.

  1. shp -> osm (using ogr2osm) -> postgres (using osm2pgsql) -> raster tiles (using mapnik).
  2. Using GeoServer to serve a WMS which can be loaded into JOSM.

Option 2 seemed to require less set up time. Simply used the GUI to load the shapefile, and apply a style. Then load the WMS into JOSM.

[caption id="attachment_1295" align="aligncenter" width="600" caption="ABS Mech Blocks with landuse styling in JOSM, with NearMap underlay."]ABS Mech Blocks with landuse styling in JOSM, with NearMap underlay.[/caption]

One caveat, if you want to load a WMS services from GeoServer into JOSM, I found the URL should look something like:

http://localhost:8080/geoserver/wms?service=WMS&version=1.1.0&request=GetMap&layers=workspace_name:layer_name&styles=&format=image/png&

Slightly unrelated but if you are using tomcat or jetty locally but only occasionally (like I do), I find it is best to use sysv-rc-conf (eg. sudo sysv-rc-conf tomcat6 off) to disable the tomcat or jetty daemon from running at boot, whilst still allowing you to start it (sudo service tomcat6 start) when you need it.

If anyone is interested in getting such data in JOSM and would like more details, just let me know.

Tags: geo, gov, osm.
Reading and Writing ESRI World Files
20th February 2011

As part of my quest to georeference the old NSW Parish Maps, I ran into the ESRI World file format...

The Format

I relied on lot on http://en.wikipedia.org/wiki/World_file as a reference when figuring out how to make sense of world files. I remade the diagram from http://en.wikipedia.org/wiki/File:WorldFileParametersSchemas.gif, into two views: pixel centric, and graticule centric (svg versions here).

World File Pixel Centric DiagramWorld File Graticule Centric Diagram

...and a difference case, where the graticules are rotated in the other direction,

World File Pixel Centric - With Left Rotation

For the purposes of my java program (which I explain below), I define theta as the angle the east/west pointing graticules (I call them lat graticules as they are shown at regular lines of latitude) make with the horizontal, and phi as the angle the north/south pointing graticules (I call them long graticules as they are shown at regular lines of longitude) make with the vertical.

Keep in mind that the image coordinate system and projected coordinate system are different (assuming we are using some kind of UTM projection).

Writing to a Wld File

Some of the parish maps have graticules shown and a reference origin for the easting and northing values on the graticules. If we can extract this information we should be able to georeference the raster maps. Actually I'm not sure what projection is used... but I think using a zone of universal transverse mercator should be okay. Also I assume that the eastings and northings on the map are in chains.

The first step is extracting the graticules from the raster map to vectors. I do this by loading the image into Inkscape and tracing the graticules as line segments, with an svg path id for the segment something like "w220", for example to indicate west 220. After I have this svg file I run it through pmap-svggraticules2csv.pl which extracts these vector graticules from the svg file and saves them into a csv file.

[caption id="attachment_1275" align="aligncenter" width="421" caption="Example of vector graticles drawn over the raster map. Base map is Public Domain."]Example of vector graticles drawn over the raster map. Base map is Public Domain.[/caption]

From the csv file I then can use my Java program graticules2wld to find a best fit world file (which is really just an affine transformation matrix) to georeference this raster image via a best fit approach.

An alternative is to use pmapgrid2gcps.pl to extract ground control points (GCPs) from the svg file by finding the intersection points of the graticules. You can then pass these gcps to GDAL, to either warp the image or use gcps2wld.py (from the Debian package python-gdal) to make a best fit world file from the gcps.

I've made a debian package for the graticules2wld program. The package was really hard to make, although in the end I finally did get it working. I ended up using jh_makepkg on just the source (i.e. using no external buildfiles, just the source code). If you want to make the debian package yourself you should be able to grab this directory, then under graticules2wld-0.1 run dpkg-buildpackage. If you are able to help me so that I'm not duplicating my code in this deb-source directory in the source tree, please help me.

The Next Step...

Half the point of using the world file, is so I can load the original image into JOSM and apply the affine transformation matrix (from the world file) to show the raster as a backdrop without having to warp the image unnecessarily. So my next step is to get JOSM to be able to open raster images with a world file and correctly place it as a backdrop in the editor window.

Tags: dev, geo.
GDAL with MrSID, BOM Geofabric Dataset
26th January 2011

GDAL 1.8 with MrSID

Since moving to Debian I no longer had the MrSID reader for GDAL. It's non free software so I could do without it, but some data I have was only provided in MrSID format, and I need to get it out of the format. I used the binaries from http://developer.lizardtech.com/ (http://www.lizardtech.com/developer/members/download.php?dl=Unified_DSDK_8.0_linux.x86-64.gcc41.tgz), along with http://download.osgeo.org/gdal/gdal-1.8.0.tar.gz. I used this ./configure line (which fixes the "skipping incompatible /lib/Release/libltidsdk.a when searching for -lltidsdk" error). Binaries are put in apps.

./configure --with-spatialite --with-poppler --with-libkml --with-mrsid=/home/pathto/Unified_DSDK_8.0_linux.x86-64.gcc41/Raster_DSDK --with-jp2mrsid --libdir=/home/pathto/Unified_DSDK_8.0_linux.x86-64.gcc41/Raster_DSDK/lib

BOM Geofabric Dataset

A while back the Bureau of Meteorology made available the Australian Hydrological Geospatial Fabric dataset licensed for use under Creative Commons 3.0 license. It is available at ftp://ftp.bom.gov.au/anon/home/geofabric/. I was unable to read the files in the supplied formats, so upon my request the BOM made available the files in ESRI Shapefile format, if you would like the files in SHP file format you should make a request to AHGF@bom.gov.au. (or give me a public FTP server I can upload the dataset to).

Once I had the SHP files, I used ogr2osm to convert them to OSM files, which I could then load into JOSM.

[sourcecode language="bash"]

!/bin/sh

for f in SH_*SHP/SH/.shp do echo "$f"

# clip the source shp files
# EPSG:4326 is WGS84 LL
# we convert to EPSG:4326 as this allows us to specify the clip bbox in WGS84
dir=`dirname &quot;$f&quot;`
mkdir -p &quot;01-trim/$dir&quot;
ogr2ogr -t_srs EPSG:4326 -clipdst minlon minlat maxlon maxlat  &quot;01-trim/$f&quot; &quot;$f&quot;

# run ogr2osm with output file specified
base=`basename &quot;$f&quot;`
mkdir -p &quot;02-osm/$dir/&quot;
ogr2osm.py -o &quot;02-osm/$dir/$base.osm&quot; &quot;01-trim/$f&quot;

done [/sourcecode]

Apart from the learning experience this exercise seems to have been futile, as the data is far inferior to the existing data in OpenStreetMap.

Tags: geo.
OSM user history heatmap
16th January 2011

In the past few months I've been contributing to the OpenStreetMap database. From the day I started I've had privacy concerns on my mind. If a criminal goes around committing crimes, leaving behind a signature and always travelling x km from home to commit the crime, you get a nice circle around their home. So I'm interested to see what kind of pattern I'm leaving behind. Someone else has probably got an existing solution out there, but I decided to experiment and put together something myself.

I already had all my osmChange files (i.e. the ones from http://www.openstreetmap.org/api/0.6/changeset/${changeset_id}/download). I pull these daily from http://api.openstreetmap.org/api/0.6/changesets?display_name=aharvey find the changeset ids and download the osmChange files for all my new changesets. I do this as I try to keep a local copy of things I upload into the cloud, as a backup in case the service I uploaded to ever decides to cut my access. I know I should really be saving a copy of what I upload, rather than uploading then asking the cloud server for a copy, but JOSM uploads a full osm file, not an osmChange file. Scripts here.

Anyway, from these osmChange files I pull out the coordinates of all the nodes I created or modified, script here.

From this list of points I could use any heat map program. gheat which is based on http://blog.corunet.com/the-definitive-heatmap/ looks good. The problem is I ran out of time setting it up– it wasn't in the Debian repository. Instead I used http://www.sethoscope.net/heatmap/, which I combined with a wrapper script to render to tiles in the OSM Slippy Map format. However it is really slow– perhaps I should try to speed it up.

Now that I had the transparent heat map tiles, the next step was to get these on top of an OpenStreetMap map. Given they are in the standard format, it should be really easy to add this layer to any software that lets you view OSM tiles. Support for overlays like this in libchamplain is on my todo list, in the meantime I gave Polymaps a try, HTML with JavaScript embedded here.

[caption id="attachment_1246" align="aligncenter" width="600" caption="Heat map image of my created or modified nodes in OpenStreetMap"]Heat map image of my created or modified nodes in OpenStreetMap[/caption]

The results don't come as much of a surprise, I already knew which areas I edit and how much. This map is also biased towards nodes, and doesn't take into account editing an existing way or relation. One surprise was some cosmetic work along creeks shows up as nice lines (tracing a creek adds a lot more nodes than adding a single toilet node)...

Postscript

While I was working on this I once again needed a bbox string to test with. This has come up a lot in the past and I didn't know any easily way to use a GUI to position the map, and then just copy and paste the bounding box of that view. So I made a modification to one of the libchamplain demos to return a bounding box from the current view.

Tags: geo, osm.
Using exiftool to reduct EXIF metadata in some JPEGs
9th January 2011

After spending way to much time trying to edit some EXIF metadata in some JPEG photographs, I'm posting my method here for future reference.

The first thing I needed to do was geoencode/geotag the images with a GPS location tag. I did this with the perl module Image::ExifTool::Location (script here).

The second thing I needed to do was examine what metadata was in the JPEG and reduct some of it. I used exifprobe and exiftool -v to examine the metadata. I ended up using this command on each image:

exiftool -overwrite_original -scanForXMP \
 -MakerNotes:SerialNumber='0' -MakerNotes:OwnerName='' -MakerNotes:InternalSerialNumber="0" -XMP:SerialNumber= \
 -XMP:OwnerName="Andrew Harvey <andrew.harvey4@gmail.com>" \
 -XMP-cc:AttributionName='Andrew Harvey' -XMP-cc:License='http://creativecommons.org/licenses/by/3.0/' -XMP-cc:attributionURL="http://www.flickr.com/photos/andrewharvey4/"\
"file_name.jpg"

http://www.sno.phy.queensu.ca/~phil/exiftool/TagNames/Canon.html was a good reference to find out about the MakerNotes tags. Also it took me a little experimenting and research before finding out that "MakerNotes tags may be edited, but not created or deleted individually." This is why the SerialNumber tag is set to zero, and not removed. I tried to remove the camera serial numbers, but who knows, Canon probably secretly embed the serial number into the image pixel values as well...

http://wiki.creativecommons.org/XMP also provided me with some hints on how best to embed these JPEGs with at least some form of machine readable tagging as CC BY licensed.

Tags: geo, sh.
Old Maps Online
28th November 2010

I should have made a post about this a while ago, but I didn't want a half complete post, and the scope of my project kept expanding!

Part 1: Scraping

I found two huge repositories of old digitised maps of Australia, many of which are in the public domain. The National Library of Australia and Parish Maps from the Department of Lands NSW. Unfortunately they didn't really have a nice documented RESTfull API for the use of the images and metadata. My first step was to extract as much information as I could and convert it into an intermediate format. Most of my code and documentation for doing this is at https://github.com/andrewharvey/govscrape in those two respective folders. Unfortunately it's not as easy as running one command from my repo to download and parse all the data. My goal was to get the data to my machine, not write a robust system that anyone could run to get a clone of the nla and pmap repositories.

Part 2: Georeferencing

It would be great if I could push out an easy to use API for the data I collected from the scrape stage, but I don't have the resources (let me know if you are willing to help out with server resources to host these old public domain maps). Even without a nice interface to the data, I could still play around with it and to see what use I could make of it. I dabbled into using these maps as a source of data for OpenStreetMap. I only got through a few of the maps, I put this on hold as I figured it would be easier (especially for others) to do this if they were georeferenced. I tried out both http://warper.geothings.net/ and QuantumGIS, but both had way to much lagging. So I rolled out my own solution which was just a bunch of scripts which used Inkscape and a hacked libchamplain demo as the GUI. The code and documentation for this is at https://github.com/andrewharvey/georeferencing-scripts.

The georeferencing data that I have made so far (it's a big task!) is at https://github.com/andrewharvey/georeferencing-data.

Part 3: Sharing

From the data and code from the last step, I'm able to push out these old maps in several formats. I used gdalwarp to convert the maps into Transverse Mercator (well actually I don't really know what they are, but this seems to work), from here I can use gdal2tiles.py (...finally understanding the difference between OSM Slippy map tilesnames and the OGC TMS... take note that gdal2tiles.py produces TMS format tiles which differs from OSM style as it has the y axis going bottom to top, see http://groups.google.com/group/maptiler/browse_thread/thread/aa89fc726b8f7261/8bdc39d7829cc80c) to push out an OSM slippy map like tile directory, I can push out a KML GroundOverlay, or you could probably use a WMS server to push it out through WMS. I really wanted to leave it open.

[caption id="attachment_1235" align="aligncenter" width="600" caption="Overlay from public domain map, http://nla.gov.au/nla.map-rm2795. Background CC BY-SA 2.0 OpenStreetMap Contributors, http://www.openstreetmap.org/"][/caption]

[caption id="attachment_1236" align="aligncenter" width="600" caption="Parishmap as backgrop in JOSM. Data CC BY-SA 2.0 OpenStreetMap Contributors, http://www.openstreetmap.org/. Background public domain map PMapMN04/14015601."]Parishmap as backgrop in JOSM.[/caption]

[caption id="attachment_1237" align="aligncenter" width="600" caption="Overlay from public domain map, PMapMN04/14015601. Background CC BY-SA 2.0 OpenStreetMap Contributors, http://www.openstreetmap.org/"]Parish map overlaid on OSM mapnik layer.[/caption]

I would post a Google Earth one too, but its too much effort to get a free background in there for the screenshot. I'm not convinced that this display of the data is user friendly. Having control of the transparency of the overlay is a must. Maybe one day, someone will crop out all the non-map parts of the parish maps so we can get a single whole of NSW parish map slippy map.

I suppose now I need to focus on the infrastructure. It should be really easy for a user to browse the available maps and view them either as a KML, an OpenLayers overlay. I should also plug this into the meta-data I scraped and have stored in CSV like files.

The problem I have with distribution right now is that many of the maps need warping and that means I need to host the warped image somewhere. Some could probably be georeferenced from their source image using just translate, scale and rotate, and hence should be able to use the source image from the government server to serve the georeferenced imagery. But the work flow I've set up so far, relies on using gdalwarp, and hence having access to the warped image.

Tags: geo, gov, osm.
Some experiments with OpenStreetMap Overlays and NearMap Oblique Views
11th October 2010

...I was thinking, short of having a high resolution accurate computer model of the world (i.e. digital terrain model with an orthophoto on the terrain + accurate 3D models of buildings, bridges, trees, etc), one can use these "oblique" aerial views to similate other low angle views.


[caption id="attachment_1178" align="aligncenter" width="573" caption="Sydney North Oblique view. Image tiles from NearMap. Used under the http://www.nearmap.com/products/community-licence license."]Sydney, North Oblique View. Tiles from NearMap. Used under the http://www.nearmap.com/products/community-licence license.[/caption]


What I mean is that Google Earth uses orthophotos as the ground texture. For some places they also have rough building models and these make low angles (ie. when you are not looking straight down towards the earth's surface) in Google Earth look a little bit more real. An alternative, when we lack a high resolution accurate model, for an interactive Google Earth like application is to use overhead orthorectified imagery when the user is looking from above, and use the oblique views (called MultiView on NearMap) when the angle between the direction of view and the ellipsoid surface normal gets larger. For a 2D web interface when the user changes from the overhead imagery to the oblqiue views, the imagery could fade from one to the other.


[caption id="attachment_1179" align="aligncenter" width="600" caption="Sydney North Oblique viewed in Google Earth from a lower angle (not straight above). Image tiles from NearMap. Used under the http://www.nearmap.com/products/community-licence license."]Sydney North Oblqiue viewed in Google Earth from a lower angle (not straight above). Image tiles from NearMap. Used under the http://www.nearmap.com/products/community-licence license.[/caption]


I hope to also get libchamplain to overlay transpanent map tiles on top of imagery (more on that in the next post), because I really think that oblique views make map reading much easier for the user (although the South, East and West can be a little confusing when viewed at high zooms on a 2D map, just like looking at the world map upside down can be a little confusing at first you just have to think a little bit harder to work out what your looking at, see South and East views further below).


[caption id="attachment_1181" align="aligncenter" width="600" caption="Sydney North Oblique Imagery from NearMap with OpenStreetMap tiles on top. OSM tiles and data CC-BY-SA 2.0 http://www.openstreetmap.org/, NearMap imagery http://www.nearmap.com/products/community-licence."]Sydney North Oblique Imagery from NearMap with OpenStreetMap tiles on top. OSM tiles and data CC-BY-SA 2.0 http://www.openstreetmap.org/, NearMap imagery http://www.nearmap.com/products/community-licence.[/caption]


[caption id="attachment_1182" align="aligncenter" width="600" caption="North Oblique Imagery from NearMap with OpenStreetMap tiles on top. OSM tiles and data CC-BY-SA 2.0 http://www.openstreetmap.org/, NearMap imagery http://www.nearmap.com/products/community-licence."]North Oblique Imagery from NearMap with OpenStreetMap tiles on top. OSM tiles and data CC-BY-SA 2.0 http://www.openstreetmap.org/, NearMap imagery http://www.nearmap.com/products/community-licence.[/caption]


[caption id="attachment_1183" align="aligncenter" width="600" caption="Sydney South Oblique View. Image tiles from NearMap. Used under the http://www.nearmap.com/products/community-licence license."][/caption]


[caption id="attachment_1184" align="aligncenter" width="600" caption="Sydney East Oblique View. Image tiles from NearMap. Used under the http://www.nearmap.com/products/community-licence license."]Sydney East Oblique View. Image tiles from NearMap. Used under the http://www.nearmap.com/products/community-licence license.[/caption]


Soon I'll post up some stuff about NearMap in libchamplain, and my plans to set up some kind of object recognition to find objects like zebra crossings, the yellow school zone rectangle, cars... from imagery for integration into OpenStreetMap.

Tags: geo, nearmap, osm.

RSS Feed